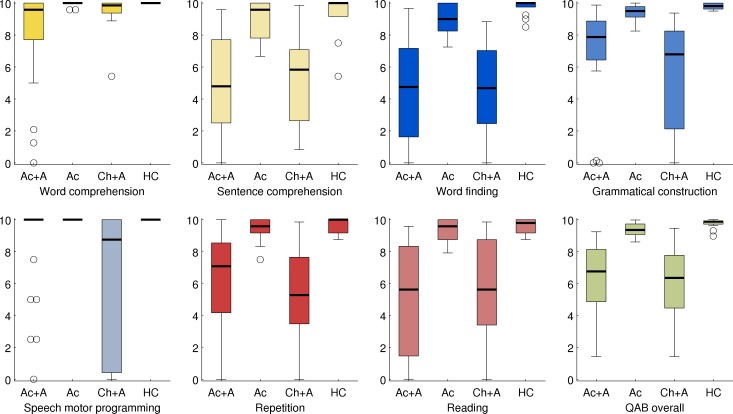
Fig 10. Distributions of the eight QAB summary measures.
Boxes = interquartile range; whiskers = range not including outliers; plusses = outliers; thick horizontal lines = medians; Ac+A = acute stroke patients with aphasia (n = 28); Ac = acute stroke patients without aphasia (n = 25); Ch+A = chronic stroke patients with aphasia (n = 16); HC = healthy control participants (n = 14). Each measure is color-coded to match subsequent figures.

