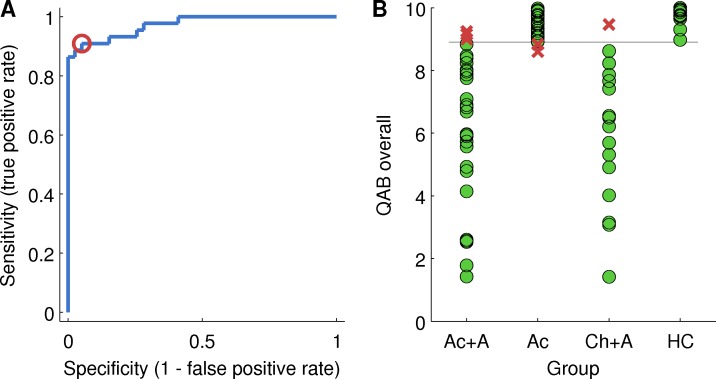
Fig 12. Determining a cutoff for diagnosis of aphasia.
(A) Receiver operating characteristic (ROC) plot of sensitivity versus specificity. The sensitivity and specificity at the chosen cutoff of 8.9 is indicated with a red circle. (B) Diagnosis based on this cutoff, relative to clinical impression. Green circles = correctly diagnosed patients; Red crosses = incorrectly diagnosed patients.

