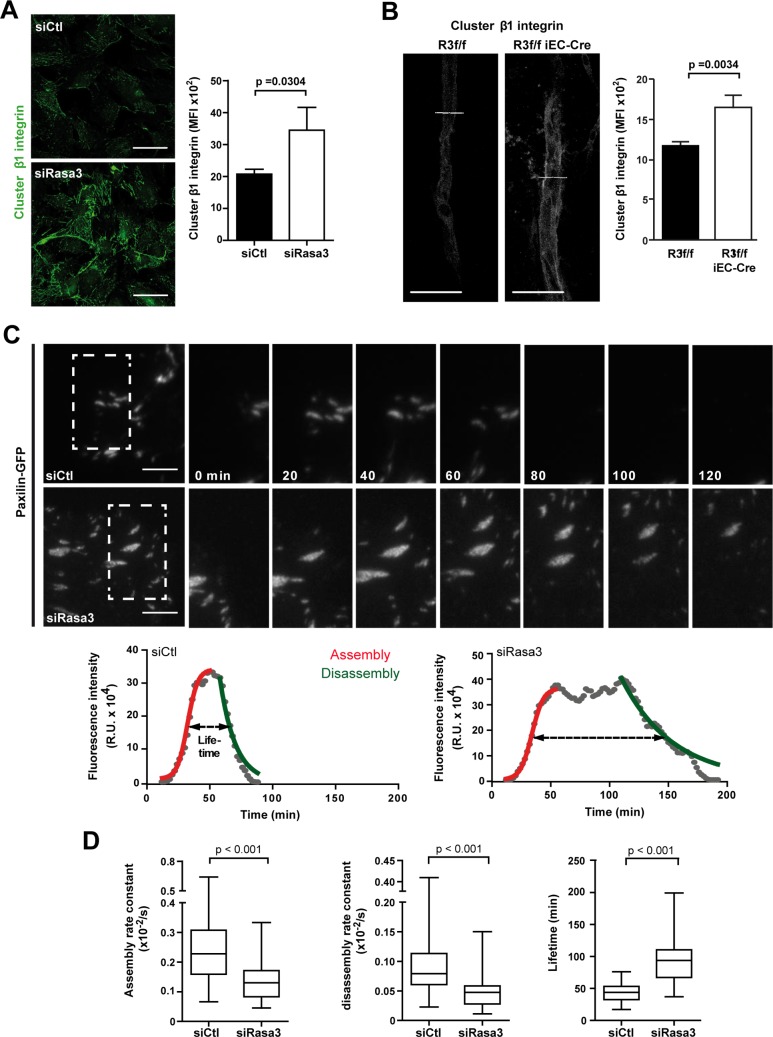
Fig 4. Depletion of Rasa3 impairs EC adhesion turnover.
A-B. Activation of β1 integrin was analyzed in HUVECs transfected with control or Rasa3 siRNA (A) and in R3f/f and R3f/f iEC-Cre aortic ring sprouts (B) by confocal microscopy using an antibody specific for clustered β1 integrin. Representative images are shown. Bars = 50 μm. Histograms represent mean ± SD of clustered β1 integrin mean fluorescence intensity (MFI) from 3 independent experiments. The p values are shown (Student’s t-test). C. Time-lapse sequences of paxillin-GFP dynamics in migrating HUVECs transfected with control or Rasa3 siRNA. The regions indicated are shown at higher magnification. Graphs represent turnover dynamics in one representative adhesion experiment in control and Rasa3-depleted cells. Maximum intensity projections over the 200 min time-lapse sequences are shown as three-frame running averages. The red and green lines are respectively a logistic fit of the assembly and an exponential fit of the disassembly phase. Adhesion lifetimes are indicated by dashed arrows as defined by fluorescence intensity above the half-maximum of the fit. In the adhesion experiment shown, assembly (0,0041/s in control versus 0,0033/s in Rasa3-depleted cells) and disassembly (0,0010/s in control versus 0,0004/s in Rasa3-depleted cells) rate constants were decreased in Rasa3-depleted cells, as compared with control cells. A lag between the assembly and the disassembly was only observed in Rasa3-depleted cells. Lifetime was increased in Rasa3-depleted cells (105 min), as compared with control cells (32 min). D. Analysis of adhesion assembly rates, disassembly rates and lifetimes in 35 and 34 adhesions from control and Rasa3-depleted migrating HUVECs, respectively. The p values are shown (Wilcoxon—Mann Whitney test).

