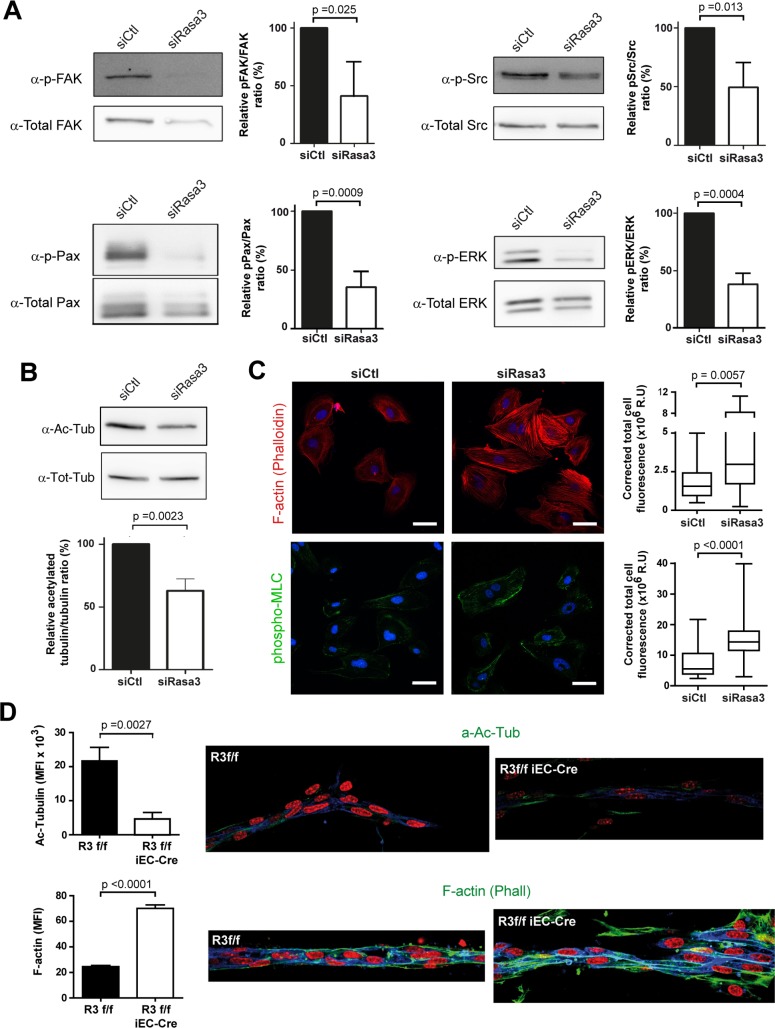
Fig 5. Rasa3 controls EC cytoskeleton plasticity.
A. Detection of FAK, Src, Paxillin (Pax) and ERK phosphorylation levels in lysates from fibronectin-plated control and siRasa3-transfected cells by Western blotting. Total FAK, Src, Paxillin and ERK levels respectively were used as control. Quantifications are shown as the ratio of phospho-specific signal over total protein signal, relative to control HUVECs. B. Detection of tubulin acetylation levels in lysates from fibronectin-plated control and siRasa3-transfected cells by Western blotting. Total tubulin (Tot-tub) levels were used as control. Tubulin acetylation was quantified (lower) as the ratio of acetylated tubulin signal over the total tubulin signal, relative to control HUVECs. Results are expressed as mean ± SD from 3 independent experiments. C. Representative confocal microscopy images of control (siCtl) and Rasa3-depleted (siRasa3) HUVECs plated on fibronectin and stained for F-actin (phallodin; red) and phospho-MLC (Green). Nuclei are stained with Hoechst (blue). Bars are 50μm. Quantifications of F-actin and phospoho-MLC signals were performed on 26 cells from 3 independent experiments and are expressed as corrected mean fluorescence intensities (MFI). Results are expressed as mean ± SD from 3 independent expriments. D. Immunofluorescence analysis of sprouts from R3f/f and R3f/f iEC-Cre aortic ring stained for the IB4 (blue) and acetylated tubulin (upper) or phalloidin (lower panel) in green. Nuclei are stained with DAPI (red). Representative images of 3 independent experiments are shown. Bars = 50 μm. (Left) Quantification of acetylated tubulin (upper) and Phalloidin (lower) mean fluorescence intensity (MFI). Data are presented as mean ± SEM of 10 sprouts per group in 3 independent experiments. The p values are shown (Student’s t-test).

