Figure 2.
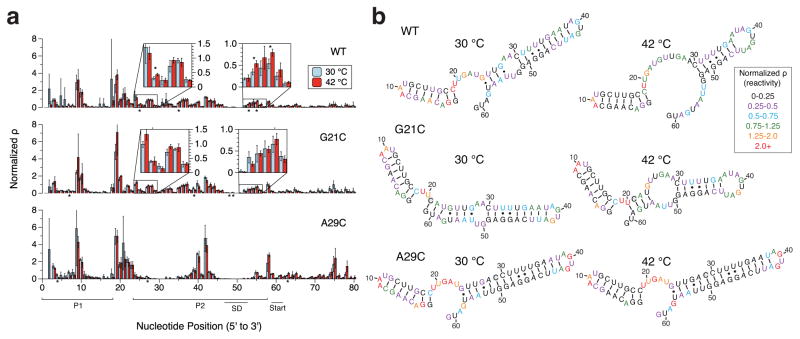
SHAPE-Seq characterization of the agsA thermometer in vivo. (a) SHAPE-Seq normalized reactivity (ϱ) plots for agsA WT, G21C, and A29C variants from triplicate experiments in vivo performed at 30 °C and using 42 °C heat shock conditions. Error bars represent standard deviations over replicates, and stars represent statistical significance between 30 °C and 42 °C reactivities. (b) Experimentally-informed minimum free energy (MFE) RNA structures as predicted using the RNAStructure Fold program with the reactivity values from (a) taken as pseudoenergy folding restraints.29 Nucleotides are color-coded according to normalized SHAPE reactivity (ϱ), with red indicating high reactivity and black low reactivity. Point-mutated nucleotides are shaded in grey.

