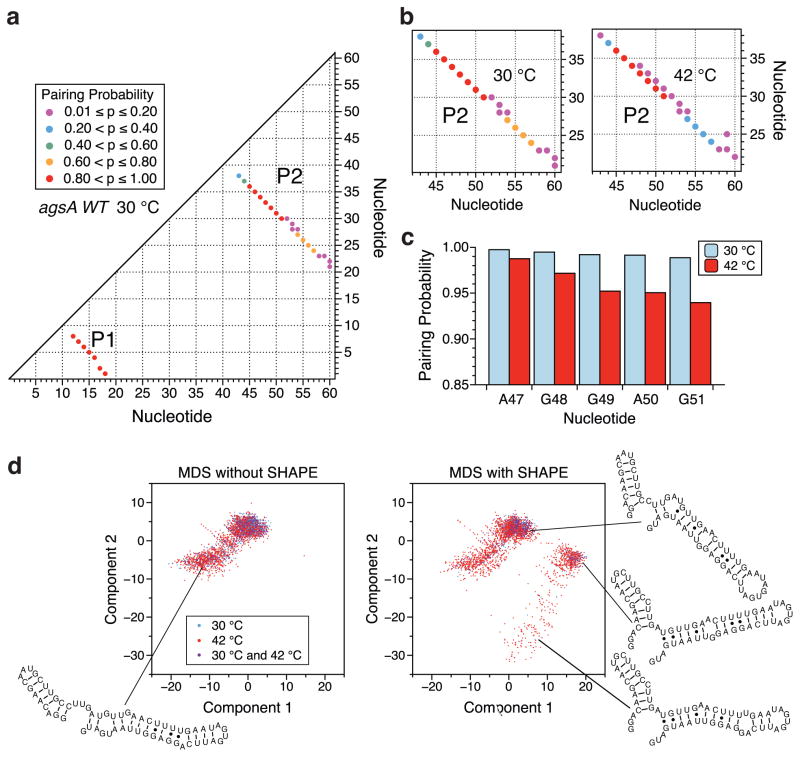
Figure 3.
Ensemble visualization of the agsA WT thermometer modeled secondary structures at 30 °C and 42 °C. (a) Pairing-probability plot for the agsA WT thermometer at 30 °C. Dots correspond to base-pairs that occur in more than 1% of the predicted structural ensemble, as restrained by in vivo SHAPE-Seq data. Nucleotide numbers are plotted along the axes, with the x and y coordinates of a dot indicating the bases involved in the pair. Dot color corresponds to pairing probability, with red being the most likely and purple the least likely. (b) Close-up of in vivo SHAPE-Seq-restrained pairing-probability plot for the agsA WT thermometer hairpin 2 at 30 °C and 42 °C. Changes in pairing probability are indicative of the opening of the helix with increasing temperature. (c) The base-pairing probabilities for the first five nucleotides of the Shine-Dalgarno sequence as determined by the structural ensemble predictions restrained by in vivo SHAPE-Seq data, plotted at both 30 °C and 42 °C. (d) Multidimensional scaling (MDS) representations of the structural ensemble of the agsA WT thermometer at 30 °C and 42 °C, with and without in vivo SHAPE-Seq restraint of structural prediction. For each condition, 100,000 structures were sampled from the corresponding partition function and visualized in 2-dimensional space via MDS as described in the Experimental Procedures section. Representative structures shown.

