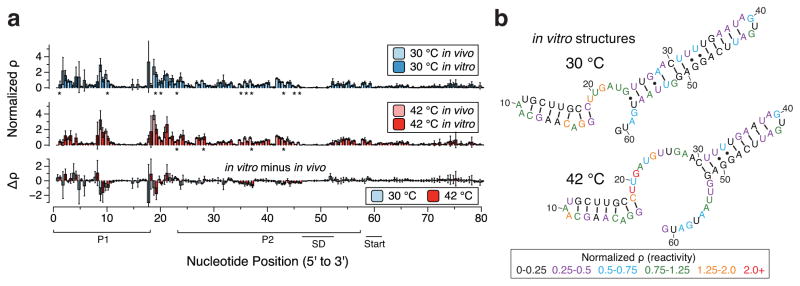
Figure 5.
SHAPE-Seq characterization of the agsA thermometer in vitro in PURExpress. (a) SHAPE-Seq normalized reactivity plots for agsA WT mRNA from triplicate experiments in vitro performed on mRNAs at 30 °C and 42 °C, graphed alongside in vivo reactivities from Figure 2a for comparison. Error bars represent standard deviations over replicates. Stars denote statistically significant differences between in vivo and in vitro as determined by heteroscedastic Welch’s T-tests, while the difference plot shows the magnitude of reactivity change (in vitro reactitivies minus in vivo reactivities). (b) Experimentally-informed minimum free energy (MFE) RNA structures as predicted using the RNAStructure Fold program with the in vitro reactivity values from (a) taken as pseudoenergy folding restraints. Nucleotides are color-coded according to normalized SHAPE reactivity (ϱ), with red indicating high reactivity and black low reactivity.

