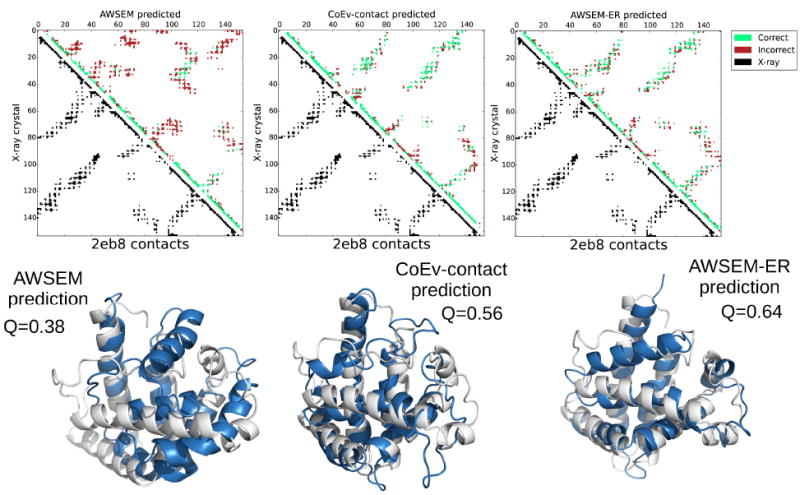
Figure 11.

Contact maps and the corresponding structures for the max Q prediction of 2eb8 from AWSEM, the coevolutionary contact model, and AWSEM-ER potentials. The best predicted structures are shown in blue, while the experimentally determined structures are overlaid in white. The contact maps show the contacts present in the experimental structure in the lower left triangle in black and the contacts in the maximum Q structure obtained via simulated annealing in the upper right. Predicted contacts that are present in the crystal structure are shown in green, whereas predicted contacts that are not present in the experimental structure are shown in red. PyMOL[53] was employed to generate the structure images.
