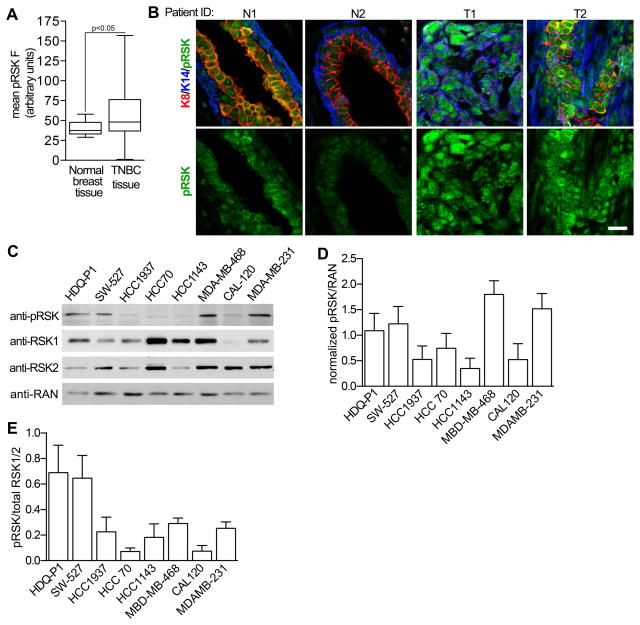
Figure 2. Active RSK in TNBC.
(A) Activated RSK levels are increased in TNBC. Bar, median ± quartile (n ≥ 5 field/tissue sample). (B) Representative paraffin-embedded sections of normal breast and TNBC tissue stained for the cytokeratins 8 (K8), 14 (K14) and phospho-Thr359/phospho-Ser363 RSK (pRSK). Scale bar = 20 μm. (C) Analysis of TNBC cell lysates normalized using the housekeeping protein, RAN. (D) Quantitation of the levels of pRSK normalized to RAN. (n=3) (E) Comparison of pRSK relative to total RSK1 and RSK2 for various TNBC lines. To control for antibody sensitivity the levels of RSK1 and RSK2 were determined using purified, recombinant protein.

