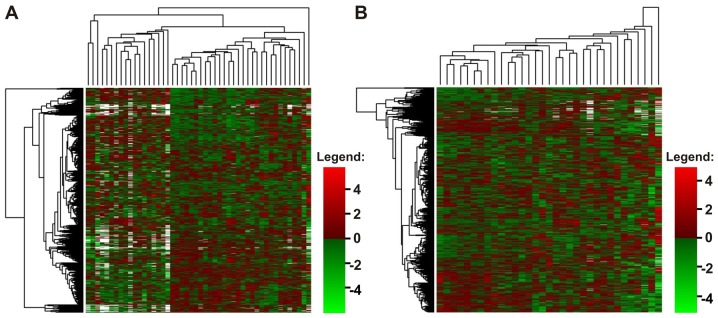
Figure 2.
Heatmaps presenting the normalized log2 expression values of all acute myeloid leukemia (AML)-array genes (horizontally) in all studied samples, (A) AML and healthy volunteers (HV), and (B) only in AML samples, excluding HV. Dendrograms represent the results of clustering: Genes (left side of the heatmap) and samples (above the heatmap). White points indicate missing values, referring to the probes with weight 0 that were excluded from the analysis because of poor quality. (A) Reveals the existence of outlier samples (first sample from the right and three samples from the left) and two major clusters (in the middle), with all HV samples collected at the left side of a heatmap. (B) Shows general homogeneity of AML samples. No clear sample clusters cannot be distinguished.

