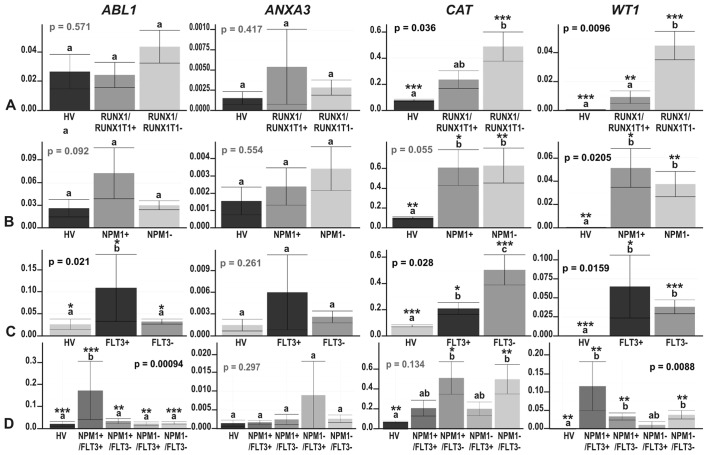
Figure 6.
The results of ddPCR-based expression analysis of 4 genes (ABL1, ANXA3, CAT and WT1) in acute myeloid leukemia (AML) compared with healthy volunteers (HV) samples, with the AML divided according to the mutation status of (A) RUNX1/RUNX1T1; (B) NPM1; (C) FLT3; and (D) NPM1 and FLT3 together. The y-axes show relative expression values of a studied gene compared to a reference gene. Each plot contains the ANOVA p-value obtained for a whole test. Pair-wise comparisons with statistically significant differences, verified with a t-test and HSD Tukey test, are indicated by letters and asterisk symbols above each bar. Bars showing the same letter indicate no significant difference (p>0.05). The numbers of asterisks denote the level of statistical significance: *p≤0.05, **p≤0.01 and ***p≤0.001.

