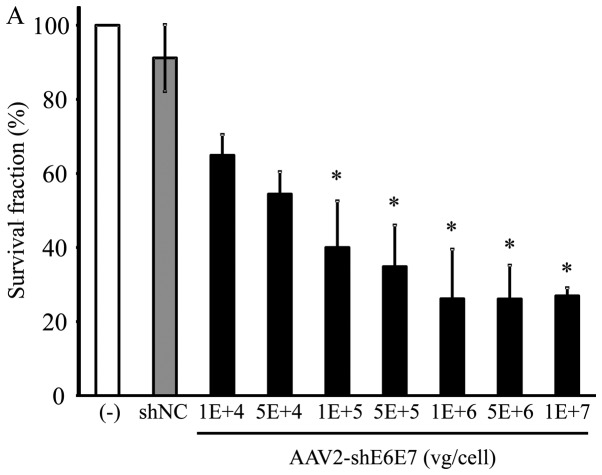
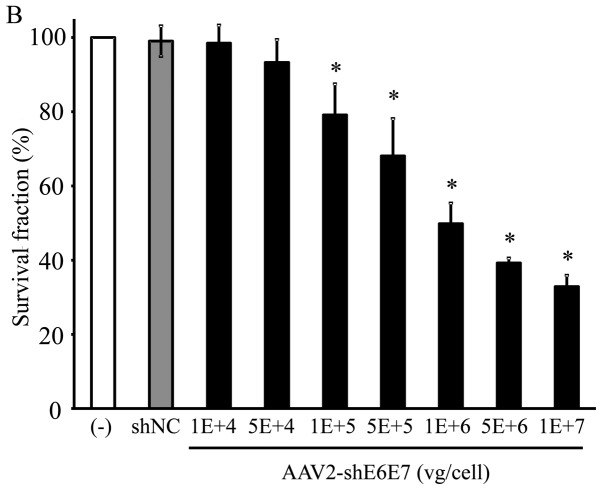
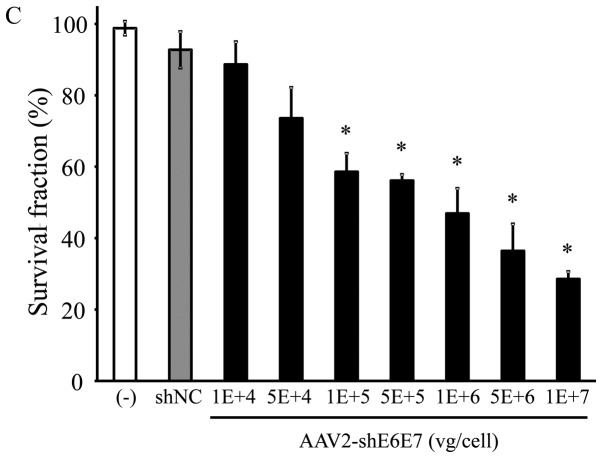
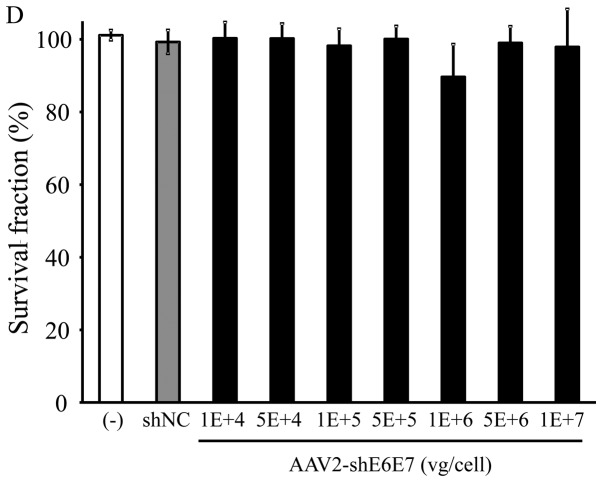
Figure 5.
Cell growth following AAV2-shE6E7 transduction. Viable cells were measured by WST-1 assay at 72 h folllowing AAV2-shE6E7 or AAV-shNC transduction (A) BOKU cells, (B) SiHa cells, (C) SKG-IIIa cells, and (D) 293 cells; *P<0.05 as compared to the AAV-shNC transduction cells. The results are presented as the means ± SD.


