. 2018 Jan 30;7:e29518. doi: 10.7554/eLife.29518

Figure 1. Establishment of the secondary naïve iPSC induction system.

(A) Representative bright field images of hiF-Ts, niPSC-Ts and reprogramming cells at the indicated time points during reprogramming. Scale bar, 100 μm. (B) Phase and OCT4-ΔPE-GFP images of niPSC-Ts and reprogramming cells at the indicated time points during reprogramming. Scale bar, 100 μm. (C) Flow cytometry analysis of the proportion of GFP+ cells in OCT4-ΔPE-GFP niPSC-Ts. (D) Immunostaining images of pluripotency-related marker expression in niPSC-Ts. Scale bar, 50 μm.

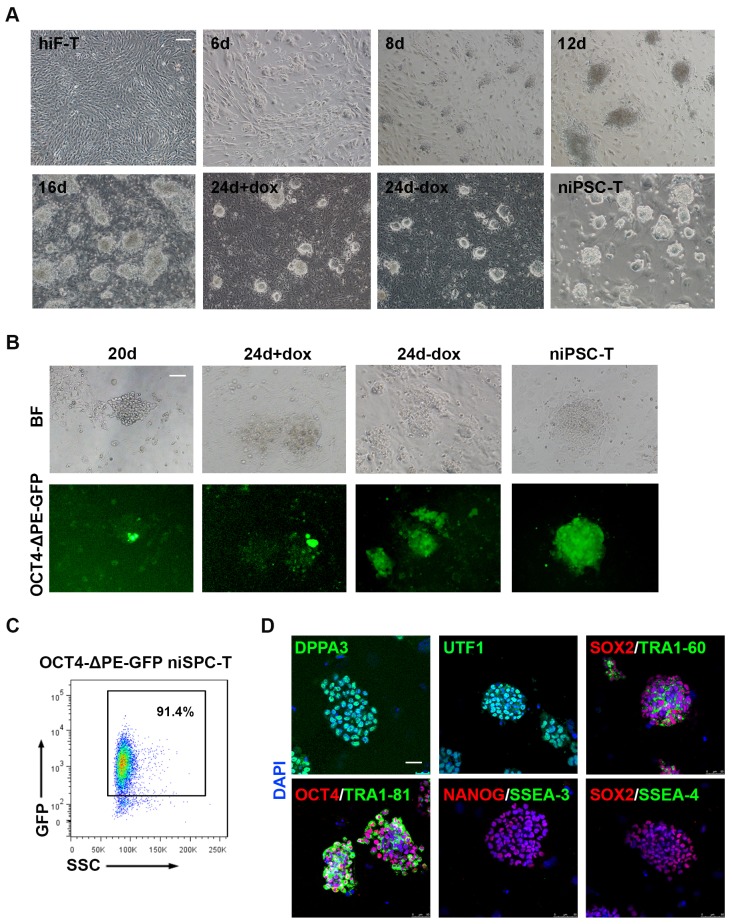
Figure 1.

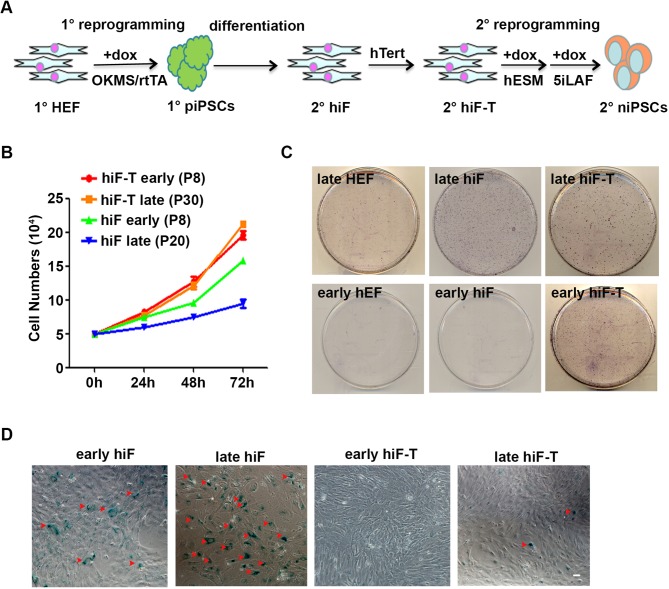
Figure 1—figure supplement 1. Optimization of secondary human naïve iPSCs reprogramming system.

Figure 1—figure supplement 1.

(A) Schematic overview of secondary naïve reprogramming strategy to generate human naïve iPSCs. 1° HEF, primary human embryonic fibroblasts; 1° piPSCs, primary primed iPSCs; 2° hiF, inducible fibroblasts; 2° hiF-T, immortalized inducible fibroblasts; 2° niPSCs, secondary naïve iPSCs. (B) Growth curves of hiF and hiF-T cells at different passages. (C) Alkaline phosphatase (AP) staining representing the naïve reprogramming efficiencies of HEFs, hiFs and hiF-Ts at different passages. (D) Representative images showing the senescent cells in hiFs and hiF-Ts at different passages by senescence-associated-beta-galactosidase (SA-β-GAL) assay. Scale bar, 50 μm. Senescent cells are stained in blue and indicated with red arrowheads.