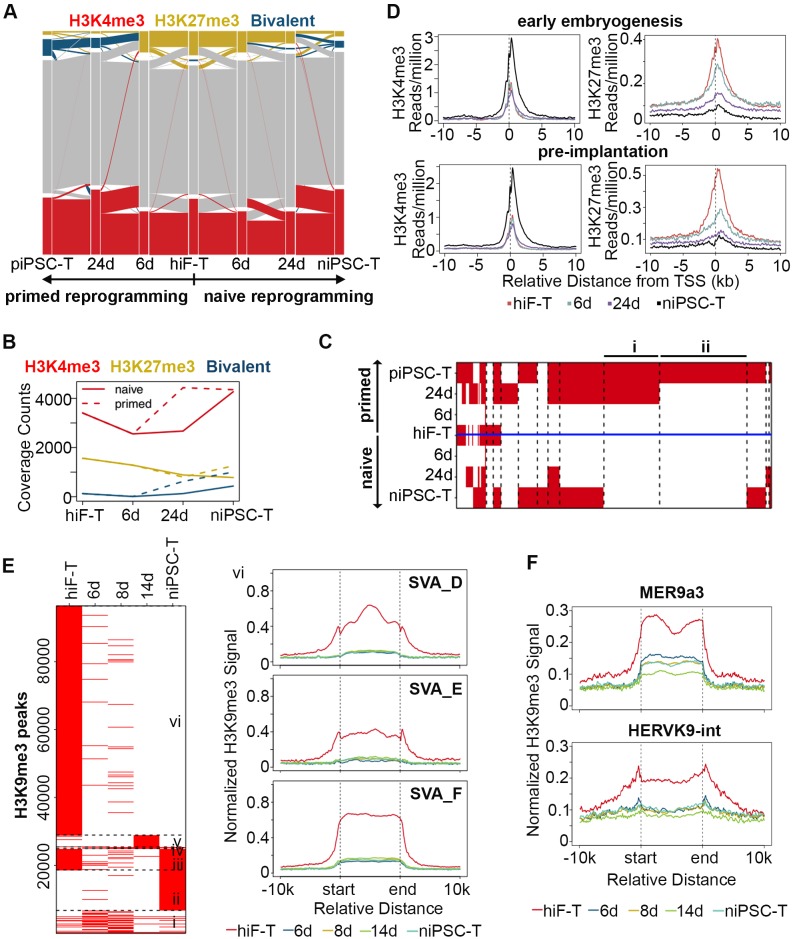
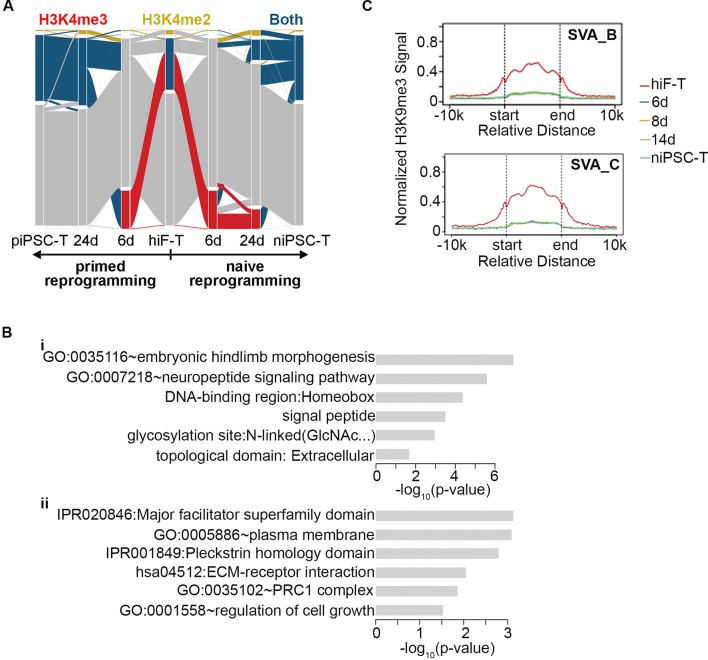
Figure 5. Histone modification profiles during naïve reprogramming.
(A) Alluvial plots showing the global dynamics of genes covered by different chromatin states during naïve reprogramming. Each line represents a gene. Red bar represents genes with promoter that covered only by H3K4me3. Yellow bar represents genes with promoter that covered only by H3K27me3. Blue bar represents genes with promoter that covered by both H3K4me3 and H3K27me3. Grey bar represents genes with promoter that covered by neither H3K4me3 nor H3K27me3. (B) Line plot showing dynamics of different histone modification signals across naïve and primed reprogramming. (C) Heatmap showing clusters of genes with different bivalency patterns across naïve and primed reprogramming. (D) Average profiles of H3K4me3 and H3K27me3 signals surrounding the TSS of genes characteristic for early embryogenesis and pre-implantation during naïve reprogramming. (E) Heatmap showing six clusters of H3K9me3 peaks with different patterns (left panel) and average H3K9me3 profiles around integrants of SVA family in cluster vi of the heatmap (right panel) during naïve reprogramming. (F) Average H3K9me3 profiling around MER9a3-HERVK-9 TE during naïve reprogramming.


