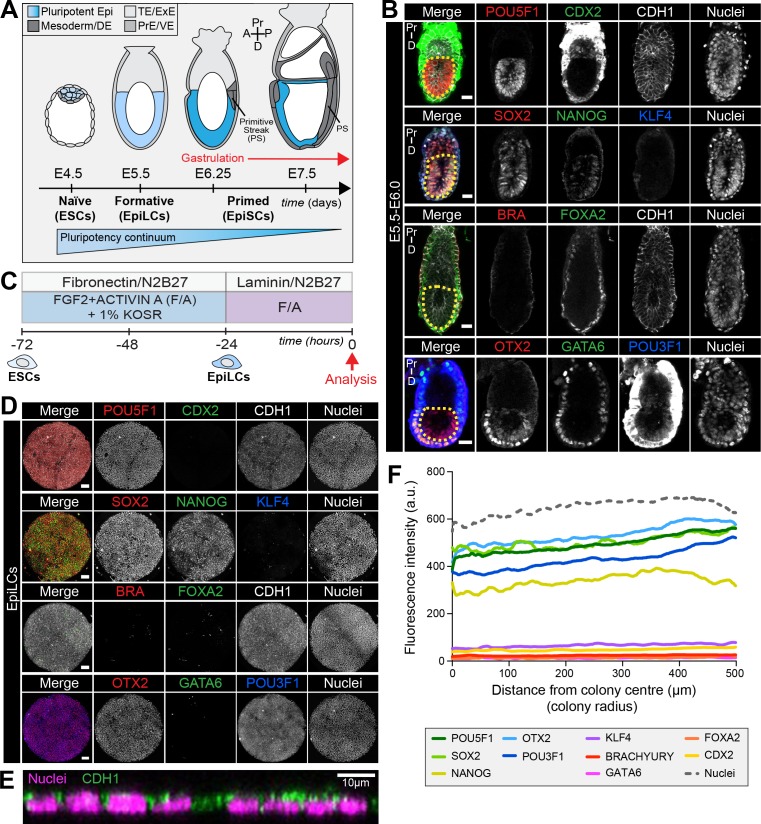
Figure 1. EpiLCs represent a pluripotent state correlating to the pre-streak epiblast of the embryo.
(A) Development of the mouse pluripotent epiblast (Epi) from embryonic day (E) 4.5 to 7.5 and correlating in vitro pluripotent states. ESCs, embryonic stem cells; EpiLCs, epiblast-like cells; EpiSCs, epiblast stem cells; TE/ExE, trophectoderm/extraembryonic ectoderm; PrE/VE, primitive endoderm/visceral endoderm; DE, definitive endoderm; A, anterior; P, posterior; Pr, proximal; D, distal. (B) Sagittal sections of immunostained E5.5-E6.0 embryos. Yellow dashed line demarcates Epi. Scale bars, 25 μm. Non-nuclear anti-BRACHYURY/CDX2/POU3F1 VE fluorescence represents non-specific binding. (C) ESCs were converted to EpiLCs on Fibronectin in N2B27 with FGF2 and ACTIVIN A (F/A) and knockout serum replacement (KOSR) for 48 hr. EpiLCs were plated onto Laminin-coated micropatterns overnight and analyzed the following day (0 hr). (D) Maximum intensity projections of immunostained 1000 μm diameter EpiLC micropatterned colonies. Scale bars, 100 μm. (E) Confocal image showing a z-axis (side profile) region of an immunostained EpiLC micropatterned colony. (F) Quantification of immunostaining voxel fluorescence intensity from center (0) to edge (500). Data represents average voxel intensity across multiple colonies. Dashed line represents average fluorescence of Hoechst nuclear stain. n = 6 NANOG/KLF4/SOX2/nuclei; n = 14 GATA6/OTX2/POU3F1; n = 14 BRACHYURY/FOXA2. BRA, BRACHYURY.


