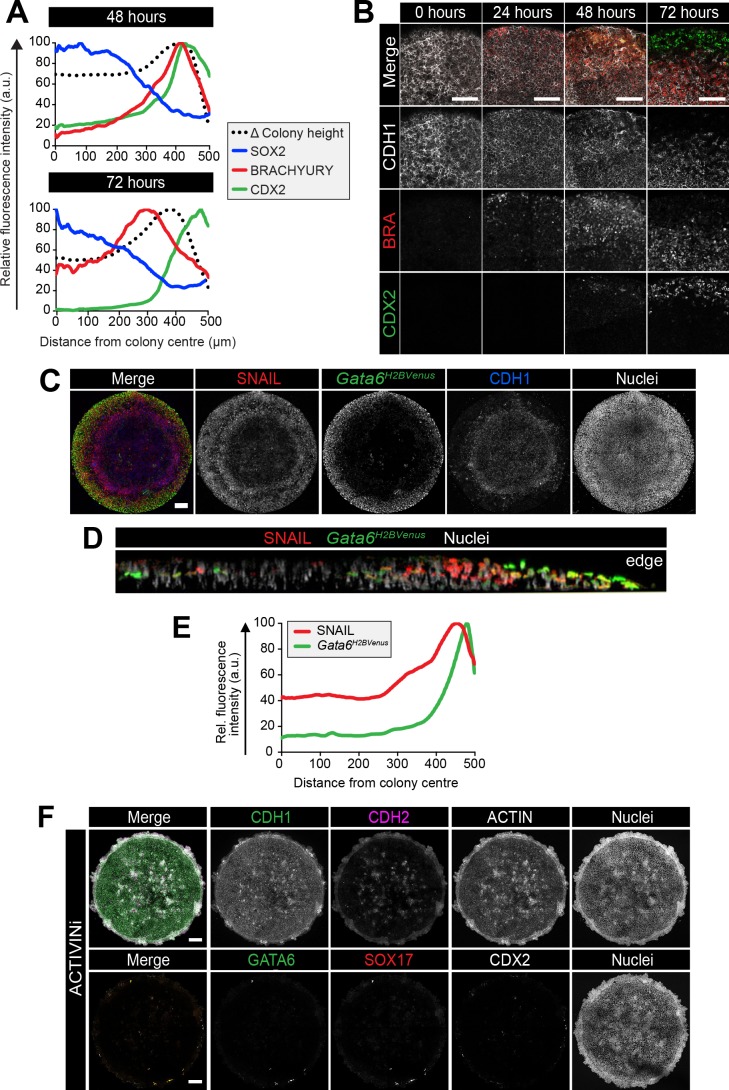
Figure 4. EMT is associated with micropatterned EpiLC differentiation.
Data from colonies differentiated as in Figure 2E. (A,B) Sagittal (A) and transverse sections (B) of late streak embryo. Dashed box marks high magnification region in lower panel. Dashed lines mark transverse planes in B. Non-nuclear anti-BRACHYURY VE fluorescence represents non-specific binding. A, anterior; P, posterior; Pr, proximal; D, distal; L, left; R, right; VE/DE, visceral endoderm/definitive endoderm; ExE, extraembryonic ectoderm; ExM, extraembryonic mesoderm; Epi, epiblast; Meso, mesoderm. Scale bars, 50 μm. (C) Quantification of colony height from colony center (0) to edge (500) across multiple colonies, three independent experiments, 0 hr: n = 11, 24 hr: n = 15, 48 hr: n = 17, 72 hr: n = 18. (D) Time-course showing brightfield images (upper panels) and MIPs of comparable immunostained colonies (lower panels). Scale bars, 100 μm. (E–G) Images of z-axis profile from colony center (left) to edge (right). (G–I) EpiLCs were plated onto micropatterns overnight with F/A. The following day medium was changed to F/A, BMP4, WNT3A (E,F) or medium blocking Activin/Nodal signaling - FGF2, BMP4, WNT3A, SB431542 (ACTIVINi, (G–I). (H) brightfield image of ACTIVINi colony. (I) MIPs of immunostained ACTIVINi colonies at 72 hr differentiation. Scale bars, 100 μm. BRA, BRACHYURY.


