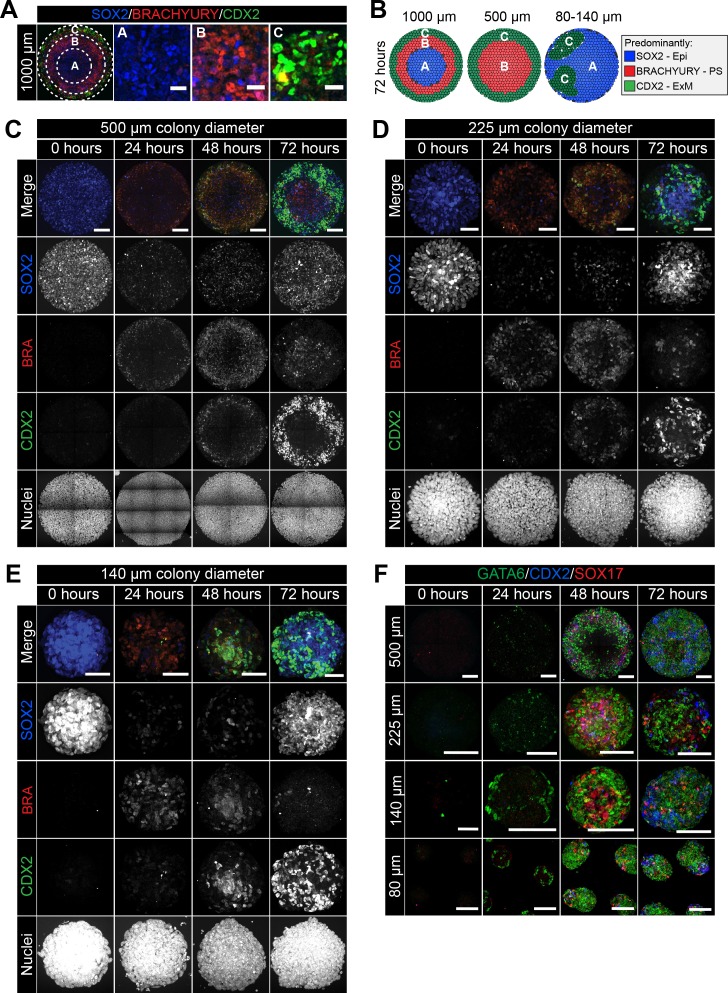
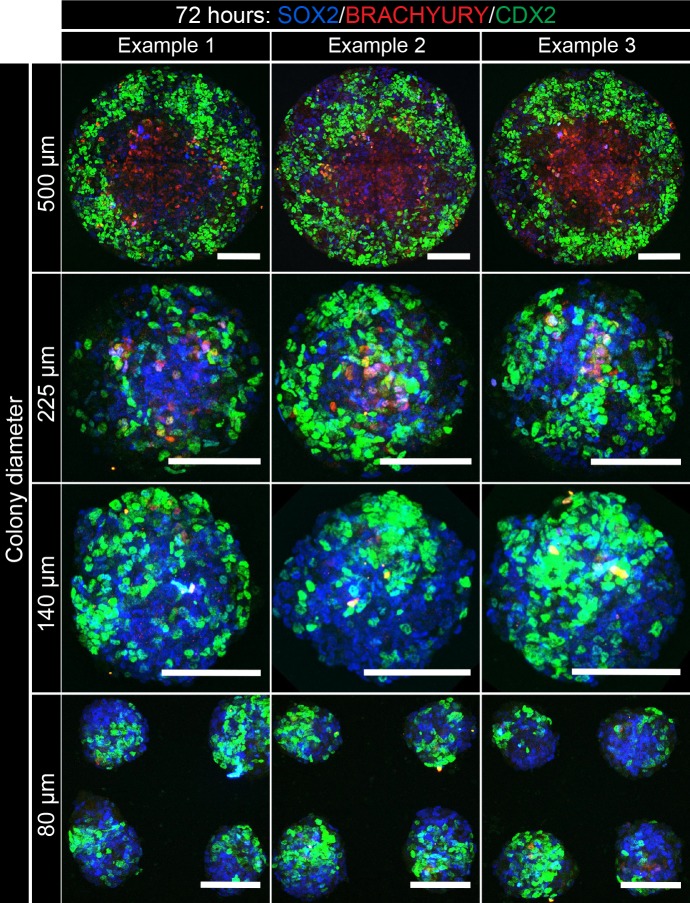
Figure 5. Smaller diameter colonies pattern in the same order of events but lose central populations.
(A) EpiLCs were differentiated with FGF2 and ACTIVIN A (F/A), BMP4 and WNT3A as described in Figure 2E. Confocal optical section of a representative 1000 μm diameter colony after differentiation. Dashed circles define 3 regions of distinct marker expression, shown at higher magnification in adjacent panels. While SOX2 is expressed quite broadly, regions were defined based on the marker that was predominantly expressed. Region A (central) = SOX2 (blue), Region B (intermediate) = BRACHYURY (red), Region C (outer) = CDX2 (green). Scale bars, 25 μm. (B) Schematic diagram showing the changing marker expression in colonies of different diameters. (C–F) Representative confocal maximum intensity projections of colonies at 0, 24, 48 and 72 hr after addition of BMP4 and WNT3A to F/A medium. Images show colonies of 500 μm, 225 μm, 140 μm and 80 μm diameter. Scale bars, 100 μm.


