(
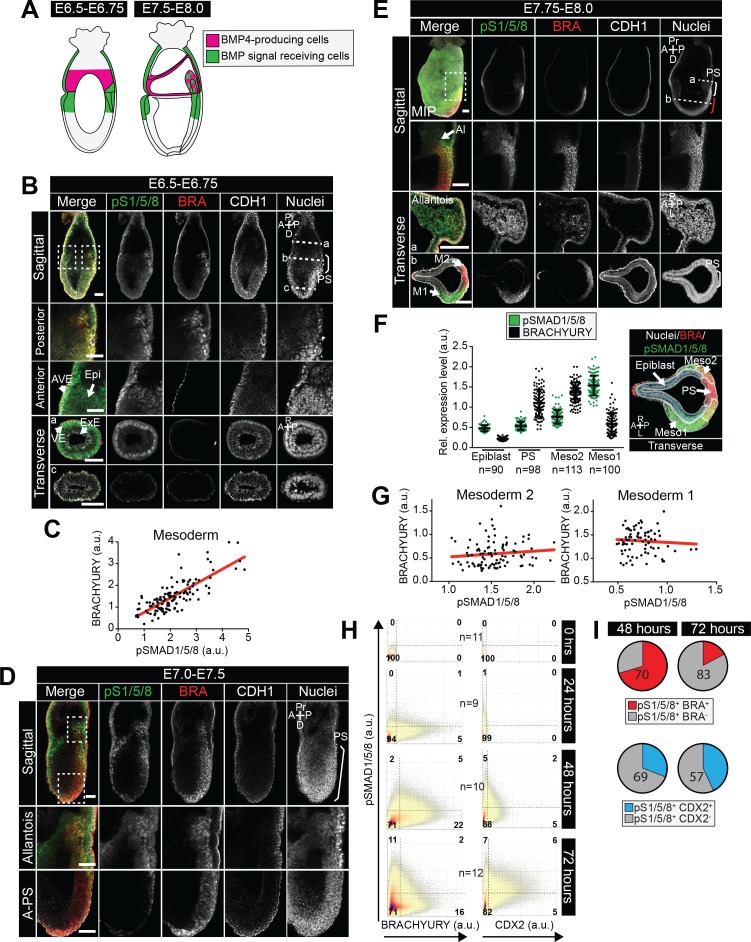
A) Schematic diagram depicting the sources of BMP (pink) within gastrulating embryos, described in (
Lawson et al., 1999). At the start of gastrulation (E6.5-E6.75), BMP4 is expressed by the extraembryonic ectoderm and later (E7.5-E8.0) in the allantois, amnion and chorion. (
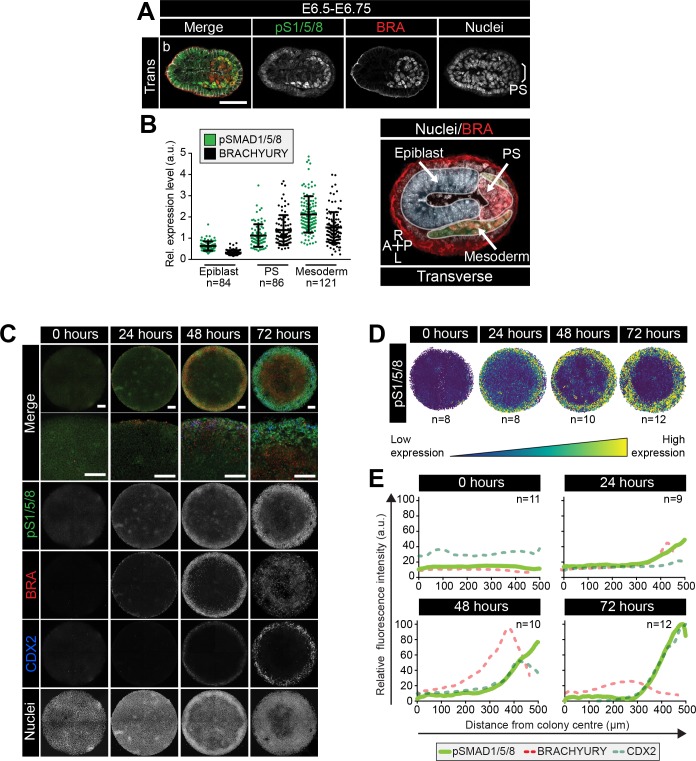
B,D,E) Representative confocal images of immunostained gastrulating embryos showing BMP signaling activity based on nuclear localization of pSMAD1/5/8. Images represent maximum intensity projections (MIP), sagittal optical sections and transverse cryosections. Transverse section ‘b’ from panel B is shown in
Figure 6A. Non-nuclear anti-BRACHYURY VE fluorescence represents to non-specific binding. AVE, anterior visceral endoderm; Epi, epiblast; ExE, extraembryonic ectoderm; VE, visceral endoderm; A-PS, anterior primitive streak; Al, allantois; M1, mesoderm 1; M2, mesoderm 2; A, anterior; P, posterior; Pr, proximal; D, distal; R, right; L, left; BRA, BRACHYURY; E-CAD, E-CADHERIN; pS1/5/8, pSMAD1/5/8. Scale bars, 50 μm. Dashed lines mark transverse plane. Dashed boxes outline regions in higher magnification in lower panels. In F, white bracket demarcates the posterior primitive streak and red bracket the anterior primitive streak. (
C,G) Scatter plots showing the levels of pSMAD1/5/8 and BRACHYURY in arbitrary units (a.u.) within single mesoderm cells of early streak (E6.5-E6.75 - C) and early headfold (E7.75-E8.0 - G) embryos. Each dot represents a single cell. Linear regression curves were fitted to the points (red line). (
F) Quantification of pSMAD1/5/8 and BRACHYURY fluorescence intensity in arbitrary units (a.u.) in early headfold (E7.75-E8.0) embryos. Cells within the epiblast, primitive streak (PS) and Mesoderm 1 and 2 (Meso1/2) were manually selected on confocal images of transverse cryosections using ImageJ software as shown in right-hand panel. The PS was identified as BRACHYURY-positive cells at the embryo posterior. Mesoderm cells were separated into two categories, those that had migrated further anteriorly and expressed low BRACHYURY and high pSMAD1/5/8 (Meso1) and those closest to the PS expressing high BRACHYURY (Meso2). Quantification was carried out on three cryosections per embryo. N, number of cells. Data represents mean fluorescence intensity normalized to the fluorescence intensity of Hoechst nuclear stain ± S.D. (
H) Quantification of marker coexpression by voxel. Each dot indicates the fluorescence intensity of a single voxel, in arbitrary units (a.u.). Color represents voxel density within the plot. Gates were defined based on the 0 hr time point where BRACHYURY and CDX2 were not expressed and pSMAD1/5/8 was expressed only at low levels. Numbers within each quadrant represent the % of voxels within gate, rounded to the nearest whole number. N, number of colonies. (
I) Pie charts illustrating the % of pSMAD1/5/8-positive cells that coexpress BRACHYURY or CDX2. Percentages shown within the largest fraction.


