. 2018 Feb 7;7:e32839. doi: 10.7554/eLife.32839

Figure 7. Anterior primitive streak fates are specified in the absence of BMP.

(A) EpiLCs generated as in Figure 1C were plated overnight onto Laminin-coated micropatterns (−24 hr) in N2B27 medium with F/A. Various conditions were used for further differentiation - F/A, BMP4, WNT3A (+BMP), F/A, WNT3A (-BMP) or F/A, WNT3A with DMH1 BMP signaling inhibitor (BMPi). Colonies were analyzed after 72 hr differentiation. (B–D, G). MIPs of immunostained 72 hr colonies. Scale bars, 100 μm. (E) Quantification of immunostaining. Voxel fluorescence intensity was measured from colony center (0) to edge (500). Data represents average voxel intensity across multiple colonies relative to maximum voxel intensity for each marker. (F) Quantification of marker coexpression by voxel. Each dot indicates fluorescence intensity of a single voxel. Color represents voxel density within the plot. Numbers within quadrants show % of voxels within the gate. N, number of colonies. (H) Schematic diagram summarizing the cell fates observed after 72 hr in vitro differentiation under conditions described in A and corresponding in vivo cell types at E7.75-E8.0. The outer domain of the micropattern colony comprises cells that coexpress SOX17 and FOXA2, representing definitive endoderm and cells that coexpress BRACHYURY and FOXA2, representing anterior primitive streak or axial mesoderm cells.

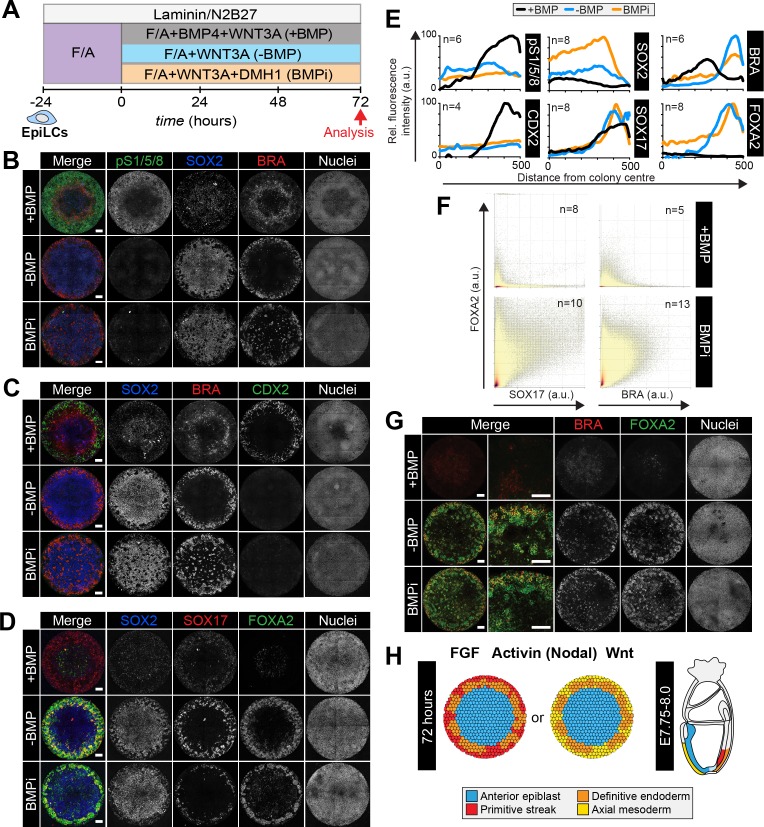
Figure 7.

Figure 7—figure supplement 1. Anterior primitive streak and definitive endoderm populations are formed in the absence of BMP.

Figure 7—figure supplement 1.

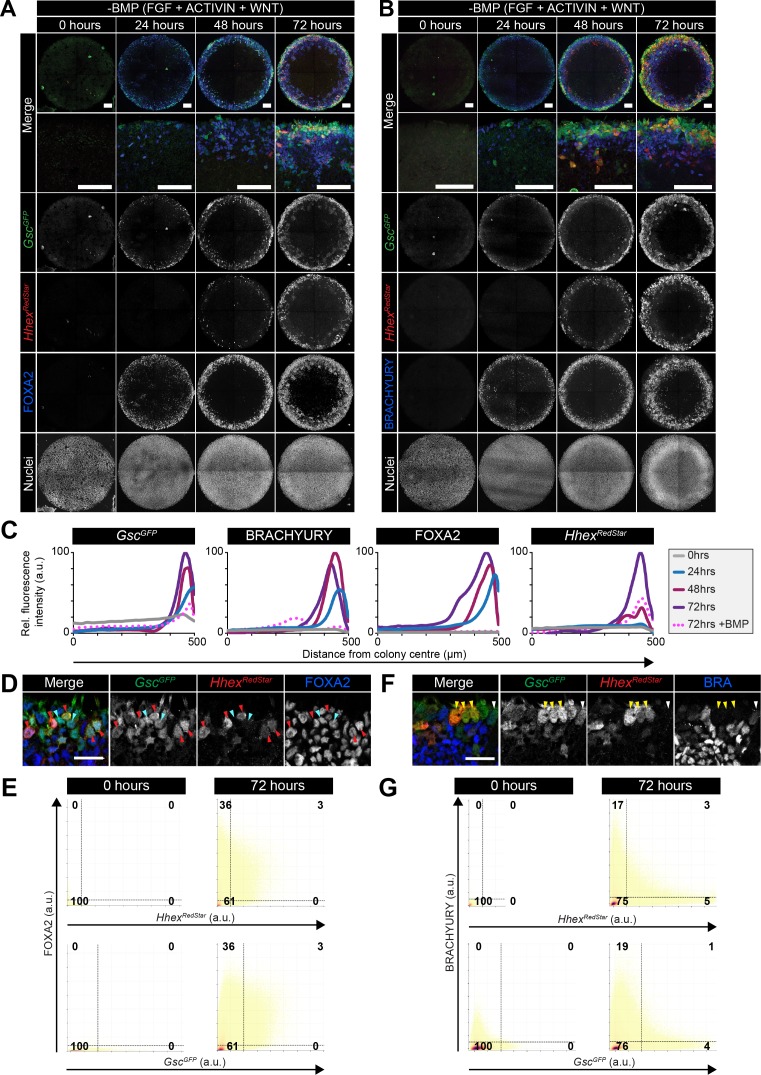
GscGFP/+;HhexRedStar/+ dual reporter ESCs were differentiated as in Figure 7A, with FGF2, ACTIVIN A, WNT3A for 72 hr. (A,B) Confocal MIPs of immunostained colonies. Scale bars, 100 μm. (C) Quantification of immunostaining voxel fluorescence intensity in arbitrary units (a.u.), from colony center (0) to edge (500). Data represents average voxel intensity across multiple colonies (n = 10/time point) relative to maximum voxel intensity for each marker. (D,F) High magnification confocal optical sections of a region of the colony edge after 72 hr of differentiation. (D) Red arrowheads mark FOXA2/GscGFP/HhexRedStar -expressing cells. Cyan arrowheads mark FOXA2/GscGFP -expressing cells. (F) Yellow arrowheads mark GscGFP/HhexRedStar –expressing cells. White arrowheads mark GscGFP/BRACHYURY –expressing cells. Scale bars, 25 μm (E,G) Quantification of marker coexpression by voxel. Each dot indicates the fluorescence intensity of a single voxel, in arbitrary units (a.u.). Color represents voxel density within the plot. Gates were defined based on the 0 hr time point when FOXA2, BRACHYURY, GscGFP and HhexRedStar were not expressed. Numbers within each quadrant represent the % of voxels within gate, rounded to the nearest whole number. n = 10 colonies/time point.
Figure 7—figure supplement 2. An anterior epiblast/neurectoderm population is formed in the absence of BMP.

Figure 7—figure supplement 2.

Sox1GFP/+ EpiLCs generated as in Figure 1C were plated overnight onto Laminin-coated micropatterns (−24 hr) in N2B27 medium with F/A. Various conditions were used for further differentiation - F/A, BMP4, WNT3A (+BMP) or F/A, WNT3A (-BMP). Colonies were analyzed after 72 hr differentiation. (A,B) MIPs of immunostained 72 hr colonies. Sox1GFP/+ cells were stained with an anti-GFP antibody. Scale bars, 100 μm. (C) Quantification of immunostaining. Voxel fluorescence intensity was measured from colony center (0) to edge (500). Data represents average voxel intensity across multiple colonies relative to maximum voxel intensity for each marker. n = 10. (D) Confocal maximum intensity projections (MIP) and transverse cryosections of an E8.0 mouse embryo. Dashed lines mark transverse plane. Al, allantois; NE, neurectoderm; ADE, anterior definitive endoderm; A, anterior; P, posterior; Pr, proximal; D, distal; L, left; R, right. Scale bars, 100 μm.