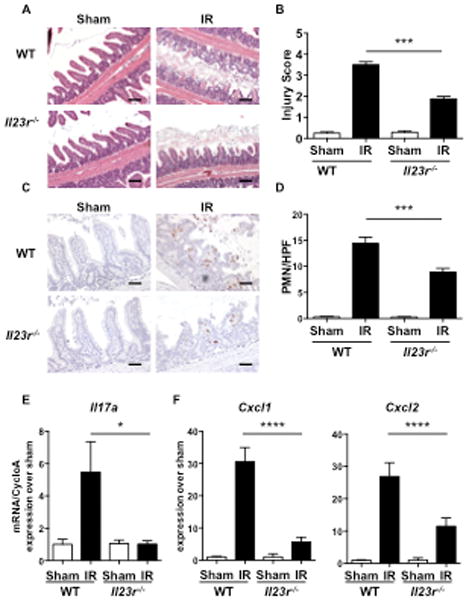
Figure 3. IR injury is attenuated in Il23r−/− mice.

A–E. Representative H&E sections (A) quantitative Injury scores (B), representative immunohistochemical staining for Gr1 (C) quantitation of infiltrating GR1+ cells (D), and qRT-PCR analysis of Il17a (E), Cxcl1 and Cxl2 expression (F) in Il23r−/− mice and WT controls subjected to intestinal IR injury or sham operated. Results are derived from three independent experiments each with 3–4 mice per group. Columns and bars represent the mean+SEM. *p< 0.05, ** p< 0.01, *** p<0.001. Photomicrographs in A 100× magnification, scale bars represent 100 μM. Photomicrographs in C 200× magnification, scale bars represent 50 μM.
