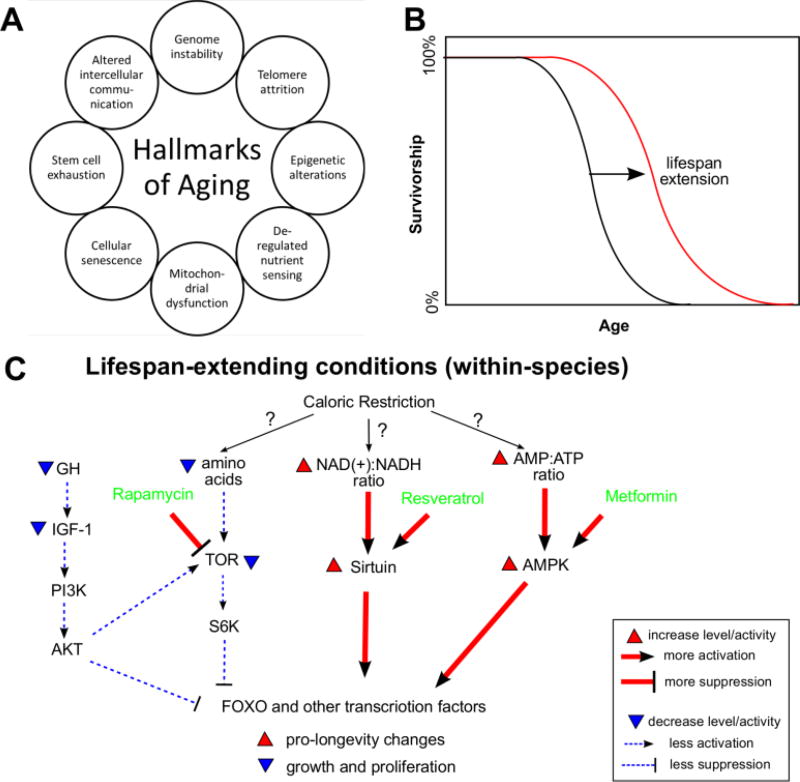
Figure 1. Aging process within a single species.
(A) Hallmarks of aging. The hallmarks are as in (Lopez-Otin et al., 2013).
(B) A typical survival curve. A successful lifespan extension strategy shifts or scales the black curve to the red.
(C) Major pathways implicated in lifespan extension. Only selected components of the pathways are shown. Cross-talks among the pathways are omitted. Caloric restriction is used as an example for illustrative purposes.

