Figure 2.
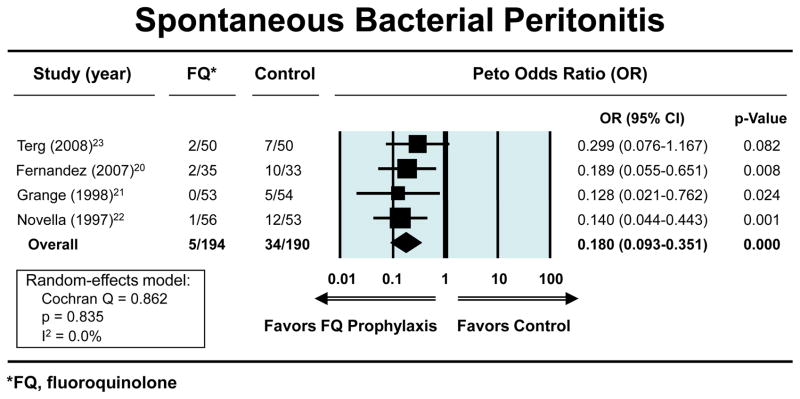
Figure 2a. Forest plots showing beneficial effect of fluoroquinolones vs. placebo in reducing the risk of spontaneous bacterial peritonitis. An OR less than 1.00 indicates risk reduction by fluoroquinolone vs. placebo
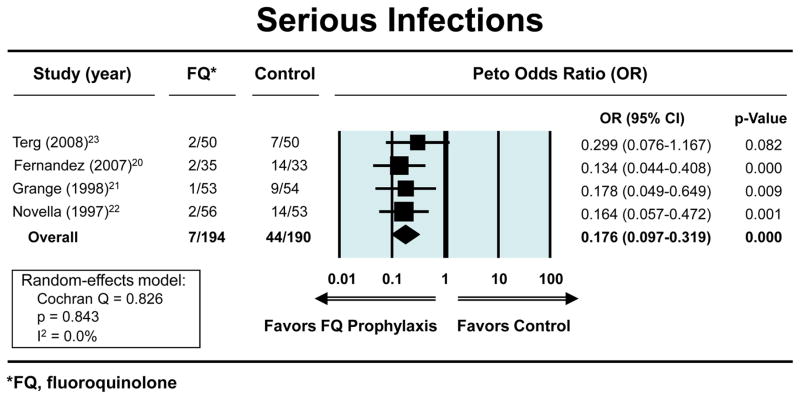
Figure 2b. Forest plots showing beneficial effects of fluoroquinolones vs. placebo in reducing the risk of severe infections. An OR less than 1.00 indicates risk reduction by fluoroquinolone vs. placebo.
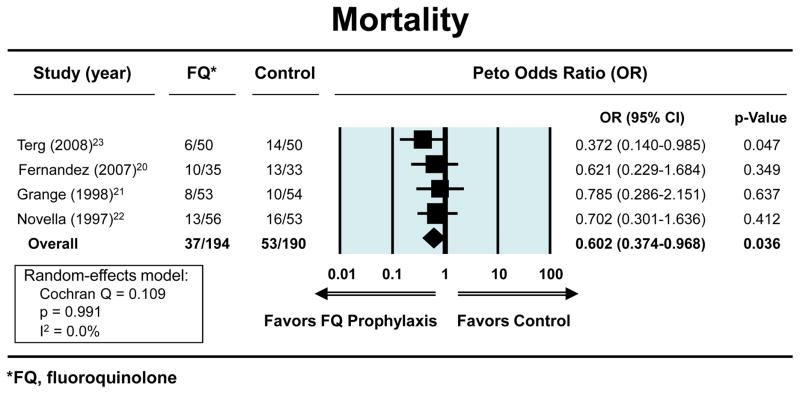
Figure 2c. Forest plots showing the beneficial effects of fluoroquinolones vs. placebo in reducing the risk of mortality. An OR less than 1.00 indicates risk reduction by fluoroquinolone vs. placebo.


