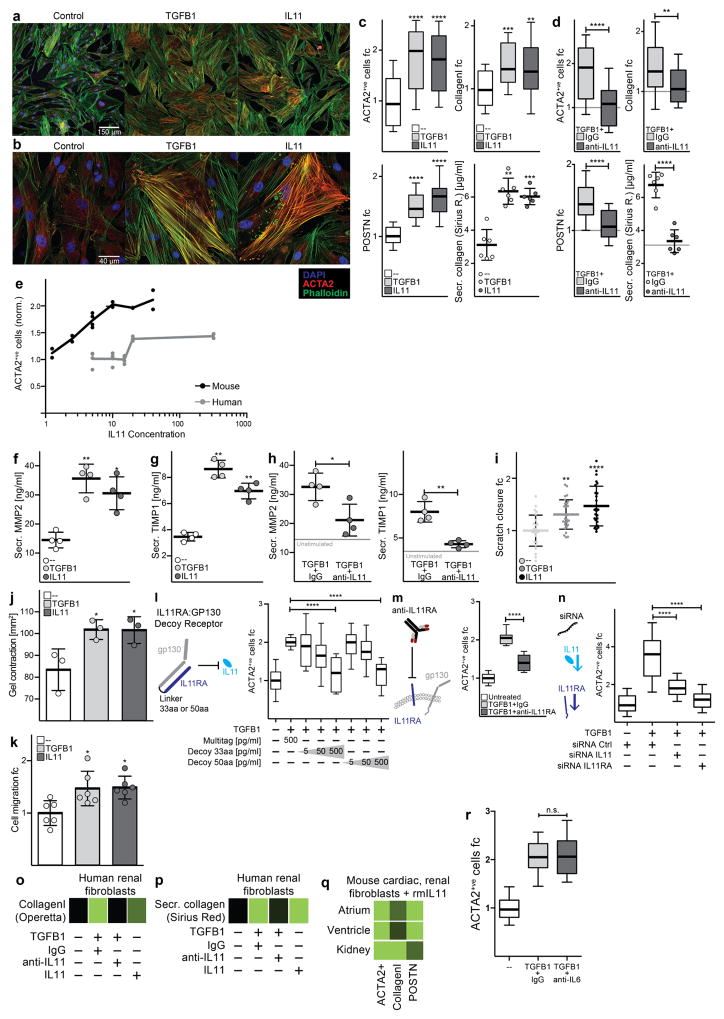
Extended Data Figure 4. IL-11 activates fibroblasts and is required for the pro-fibrotic effect of TGFβ1.
a, b, High-resolution fluorescence imaging after TGFβ1 or IL-11 treatment (5 ng ml−1, 24 h) of primary cardiac fibroblasts. Immunostaining of nuclei (DAPI, blue), ACTA2 (red) and F-actin (phalloidin, green) indicated that both TGFβ1 and IL-11 activate fibroblast stress fibre formation and increase the number of myofibroblasts in vitro to similar levels. Experiment was repeated four times with similar results. c, Automated quantification of fluorescence (Operetta assay n = 7 measurements per n = 6 independent experiments) of primary atrial fibroblasts reveals significant fibroblast activation and ECM production induced by both TGFβ1 and IL-11 (5 ng ml−1, 24 h). d, In addition, TGFβ1 effects can be reduced with an anti-IL-11 antibody (2 μg ml−1). c, d, Collagen secretion in the supernatant (n = 6 independent experiments) was assessed with Sirius Red. e, Mouse primary fibroblasts were incubated for 24 h with indicated concentrations of recombinant human or mouse IL-11. Fibroblast activation was monitored using the Operetta High-Content Imaging platform and immunostaining for ACTA2. rhIL-11 was found to inefficiently activate mouse fibroblasts (rmIL-11, n = 2, rhIL-11, n = 4 biologically independent samples) compared to rmIL-11; this occurred for rhIL-11 treatment with rhIL-11 from two separate suppliers. f, g, MMP-2 (f) and TIMP-1 (g) concentration in the supernatant (ELISA) of cardiac fibroblasts (n = 4 biologically independent samples) without stimulus (−), with TGFβ1 or IL-11 (5 ng ml−1, 24 h). h, Il-11-neutralizing antibodies (anti-IL-11, 2 μg ml−1) block the increase in MMP-2 and TIMP-1 protein. i, In vitro monolayer scratch wound assay of cardiac fibroblasts. Wound closure was compared between stimulated (TGFβ1 or IL-11; 5 ng ml−1, 24 h) and unstimulated cardiac fibroblasts (n = 5 biologically independent samples) after 24 h. j, Cardiac fibroblasts (n = 3 biologically independent samples) were seeded in collagen gel and the contraction was monitored. The area of contraction is compared between stimulated (TGFβ1 or IL-11; 5 ng ml−1) and unstimulated groups after 72 h. k, Trans-well migration assay. After 24 h of stimulation (TGFβ1 or IL-11; 5 ng ml−1), cardiac fibroblasts (n = 6 biologically independent samples) that crossed the membrane towards either a TGFβ1- or IL-11-containing compartment were colourimetrically quantified and compared to data from unstimulated cells. l–n, Cardiac fibroblasts were incubated with TGFβ1 (5 ng ml−1, 24 h) and indicated amounts of IL11RA:gp130 decoy receptors (l; 33 amino acid (aa) or 50 aa linker peptide), anti-IL11RA antibody (m; 2 μg ml−1) or siRNA pools against IL-11 or IL11RA (n). l–n, Fibroblast activation was monitored via immunostaining for ACTA2 on the Operetta platform. decoy receptors (l): n = 7 measurements per n = 2 independent experiments; anti- IL11RA (m): n = 7 measurements per n = 2 independent experiments; siRNA (n): Operetta assay n = 7 measurements per n = 10 independent experiments. o, Human renal fibroblasts were incubated with TGFβ1 or IL-11 (5 ng ml−1, 24 h) in the presence or absence of anti-IL-11 or an IgG control antibodies (2 μg ml−1 each) for 24 h. ECM was assessed using the Operetta platform by staining for collagen I. Fluorescence was normalized to non-stimulated cells (black). p, These results were confirmed with Sirius red assay of the total collagen in the supernatant. q, rmIl-11 stimulation (5 ng ml−1, 24 h) also activated mouse cardiac and renal fibroblasts. Myofibroblasts and ECM were assessed using the Operetta platform by staining for ACTA2, collagen I or POSTN. Fluorescence was normalized to non-stimulated cells (black). o–q, These experiments were repeated three times with similar results. r, Cardiac fibroblasts analysed on the Operetta high-content imaging platform with immunostaining of ACTA2 after 24 h incubation without stimulus, TGFβ1 (5 ng ml−1, 24h) or TGFβ1 and IL-6-neutralizing antibody (2 μg ml−1, 24h). Automated quantification of fluorescence (Operetta assay n = 7 measurements per n = 6 independent experiments) shows no significant decrease in fibroblast activation using anti-IL-6 antibodies. Data are mean and circles show individual values (e) or mean ± s.d. and circles show individual values (c, d bottom right, f–h, k); box-and-whisker plots (c, d, l–n, r) show median (middle line), 25th–75th percentiles (box) and 10th–90th percentiles (whiskers). Two-tailed Dunnett’s test (c, f, g, i–k), two-tailed Student’s t-test (d, h, r) or two-tailed, Sidak-corrected Student’s t-test (l–n). *P < 0.05; **P < 0.01; ***P < 0.001; ****P < 0.0001.

