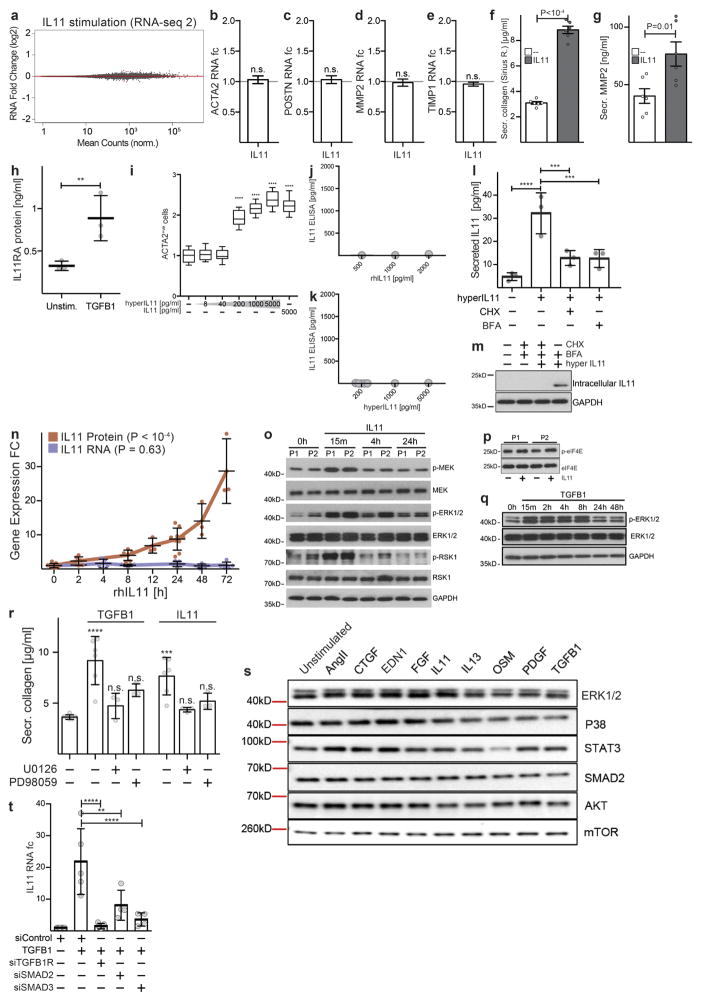
Extended Data Figure 5. IL-11 drives fibrogenic protein expression via non-canonical ERK signalling.
a, Genome-wide RNA expression differences of cardiac fibroblasts in response to IL-11 (n = 4 biologically independent samples, 5 ng ml−1, 24 h). Red indicates differentially expressed genes according to DEseq2. Fibrosis gene RNA is not increased by IL-11 treatment. b–e, RT–qPCR experiments for RNA expression of ACTA2 (b), POSTN (c), MMP2 (d) and TIMP1 (e) in response to IL-11 treatment (5 ng ml−1, 24 h) compared to unstimulated cells. IL-11 does not significantly upregulate these genes at the RNA level in cardiac fibroblasts (n = 4 biologically independent samples). f, Sirius red assay reveals significant increase in collagen protein. g, ELISA reveals increase in MMP-2 protein in the supernatant of the samples (shown in Fig. 2b, n = 6 biologically independent samples) that lack a change in RNA transcripts. h, Concentration of IL11RA (ELISA) in the supernatant of cardiac fibroblasts (n = 3 biologically independent samples) after TGFβ1 stimulation (5 ng ml−1, 24 h). i, Cardiac fibroblasts were incubated with increasing concentrations of a fusion protein consisting of IL-11 and IL11RA connected with a linker peptide that recapitulates the features of the IL-11 trans-signalling complex. Concentrations as low as 200 pg ml−1 significantly activated cardiac fibroblasts as measured using a highcontent imaging platform and staining for ACTA2 expression (Operetta assay n = 7 measurements per n = 4 independent experiments). j, k, rhIL-11 (j) and hyperIL-11 (k) were added at indicated concentrations and subsequently measured using a commercially available IL-11 ELISA (n = 1 independent experiment). The ELISA did not detect rhIL-11 or hyperIL-11. We note that the reactivity to rhIL-11 was variable dependent on batch and provider and rhIL-11 was sometimes detected. However, in all experiments presented in the main figures, we confirmed that the rhIL-11 used was not detectable by the ELISA by additional measurements. This ELISA reliably detected native IL-11 secreted by human fibroblasts. l, Cardiac fibroblasts (n = 3 biologically independent samples) were incubated (8 h) with hyperIL-11 (0.2 ng ml−1) in the presence of absence of the inhibitor of protein translation, cyclohexamide (CHX, 5 μg ml−1), or protein secretion, brefeldin A (BFA, 1 μg ml−1). Both inhibitors block the increase in IL-11 protein in the supernatant in response to hyperIL-11 treatment. m, Western blot and ELISA of IL-11 in cardiac fibroblasts after hyperIL-11, the inhibitor of the Golgi secretory pathway BFA and/or the translation inhibitor CHX treatment shows de novo protein synthesis and canonical secretion of IL-11 after stimulation. n, ELISA (n = 9 biologically independent samples) and RT–qPCR (n = 5 biologically independent samples) assays show an increase in endogenous IL-11 protein but not RNA over time after rhIL-11 (5 ng ml−1) treatment. o, ERK signalling pathway activation by TGFβ1 and IL-11. Western blots show activation of the non-canonical MEK–ERK– RSK cascade in response to IL-11 stimulation of human cardiac fibroblasts. Here the response was greatest at 15 min in the two patients analysed, but more prolonged ERK activation was also seen in additional experiments. p, Downstream substrates of ERK, such as eIF4E, were also phosphorylated by rhIL-11. q, TGFβ1 also activates the ERK pathway. The time course and degree of activation was variable between patients. r, Collagen secretion (Sirius red) from cardiac fibroblasts (control, n = 6; TGFβ1, n = 6; TGFβ1 + U0126, n = 3; TGFβ1 + PD98059, n = 3; IL-11, n = 6; IL-11 + U0126, n = 3; IL-11 + PD98059, n = 3 biologically independent samples) induced by TGFβ1 or IL-11 (5 ng ml−1, 24 h) is reduced by two separate MEK inhibitors (10 μM). s, Western blot of total protein levels of key signalling molecules in fibroblasts after 24 h stimulation with AngII (100 nM), CTGF (50 ng ml−1), EDN1 (250 ng ml−1), bFGF (10 ng ml−1), IL-13 (100 ng ml−1), OSM (100 ng ml−1), PDGF (200 ng ml−1) and TGFβ1 (5 ng ml−1). The corresponding activated protein levels are shown in Fig. 2e. t, siRNA treatment of TGFβ1-stimulated cardiac fibroblasts. RT–qPCR shows SMAD-dependent upregulation of IL11 RNA (control, n = 8; TGFβ1, n = 5; siTGFB1R, n = 5; siSMAD2, n = 4; siSMAD3, n = 4 biologically independent samples). Data are mean ± s.d. (b–h, l, n, r, t); box-and-whisker plots (i) show median (middle line), 25th–75th percentiles (box) and 10th–90th percentiles (whiskers). Two-tailed Student’s t-test (b–h), two-tailed Dunnett’s test (i, r) or Sidak-corrected, two-tailed Student’s t-test (l, t) or one-way ANOVA (n). *P < 0.05; **P < 0.01; ***P < 0.001; ****P < 0.0001.

