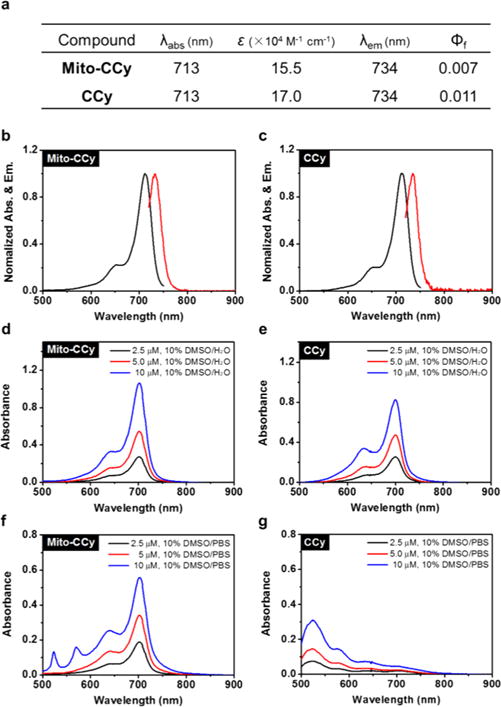
Figure 3.

UV–vis–NIR absorption and emission spectral features of Mito-CCy and CCy. (a) Photophysical data for Mito-CCy and CCy. All values were determined in DMSO. ε: molar extinction coefficient (×104 M−1 cm−1). λabs: absorption maximum wavelength (nm). λem: emission maximum wavelength (nm). Φf: fluorescence quantum yield. Normalized absorption (black) and emission spectra (red) of (b) Mito-CCy and (c) CCy. Absorption spectra of various concentrations (i.e., 2.5, 5.0, and 10 μM) of (d) Mito-CCy and (e) CCy in 10% DMSO-water solution and (f) Mito-CCy and (g) CCy in 10% DMSO-buffer solution (pH 7.4, 10 mM PBS).
