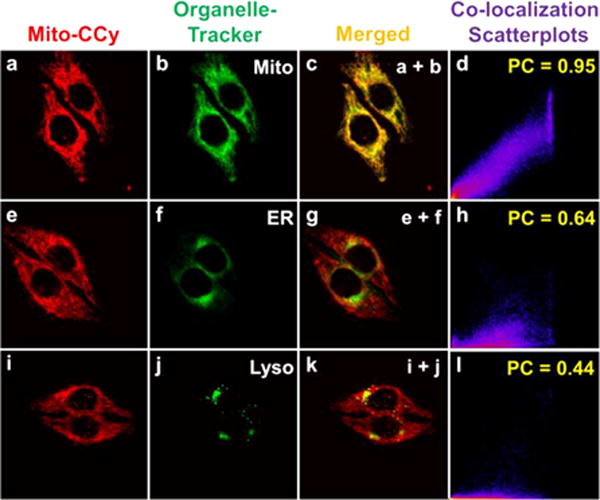
Figure 7.

Confocal microscopic images of Mito-CCy colocalized with various commercially available organelle trackers in HeLa cells (a, e, and i). HeLa cells were incubated with Mito-CCy (2.0 μM) for 4 h and then with (b) MitoTracker Green FM (0.05 μM), (f) ER Tracker Green (1.0 μM), or (j) Lysotracker Green DND-26 (0.05 μM) for 15 min. (c) Merged image of (a) and (b). (g) Merged image of (e) and (f). (k) Merged image of (i) and (j). (d) Colocalization scatterplots of (c). PC: 0.95. (h) Co-localization scatterplots of (g). PC: 0.64. (l) Co-localization scatterplots of (k). PC: 0.44. The fluorescence images of the organelle trackers and Mito-CCy were collected with 488 and 633 nm light being used as the excitation and detection wavelengths, respectively, with 505–530 nm band-pass (green) and 650 nm long pass (red) filters being employed as warranted.
