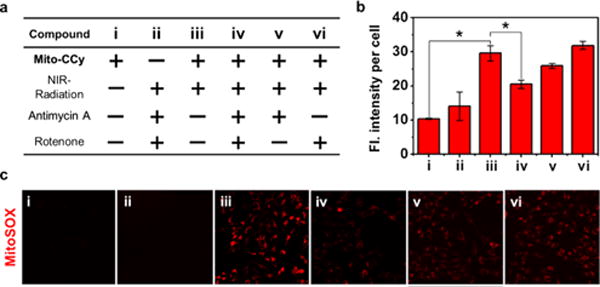
Figure 9.

Use of a ROS indicator to evaluate the production of ROS in mitochondria after incubation of HeLa cells with MitoSOX. (a) Matrix showing experimental design. (b) Fluorescence intensity per cell. *P < 0.05. (c) Confocal fluorescence microscopic images of HeLa cells treated with MitoSOX (1.0 μM) according to the treatment variables, including with or without coincubation with Mito-CCy (10 μM), 730 nm NIR irradiation (2.3 W/cm2) for 10 min, antimycin A (0.5 μM), and rotenone (0.5 μM). Fluorescence images were recorded using 488 nm excitation and 550–650 nm emission (red) wavelengths, respectively. A Ti:Sa femtosecond-pulsed laser (Chameleon XR by Coherent, 200 fs pulse width, 90 MHz repetition rate) was used. The energy density (fluence) was 1380 J/cm2.
