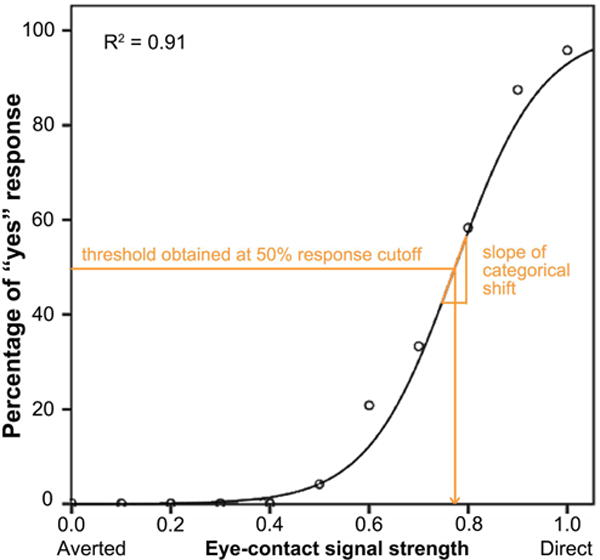
Figure 2.

An example of a participant’s psychometric curve plotting eye-contact endorsement rate as a function of eye-contact signal strength. Nine perception thresholds were obtained using response cut-offs from 10% to 90% eye-contact endorsement rate. The slope of the function when endorsement rate = 50% was used as a measure of participants’ sensitivity to eye-contact signal strength, i.e. the rate of change of the categorical shift from non-self-referential to self-referential.
