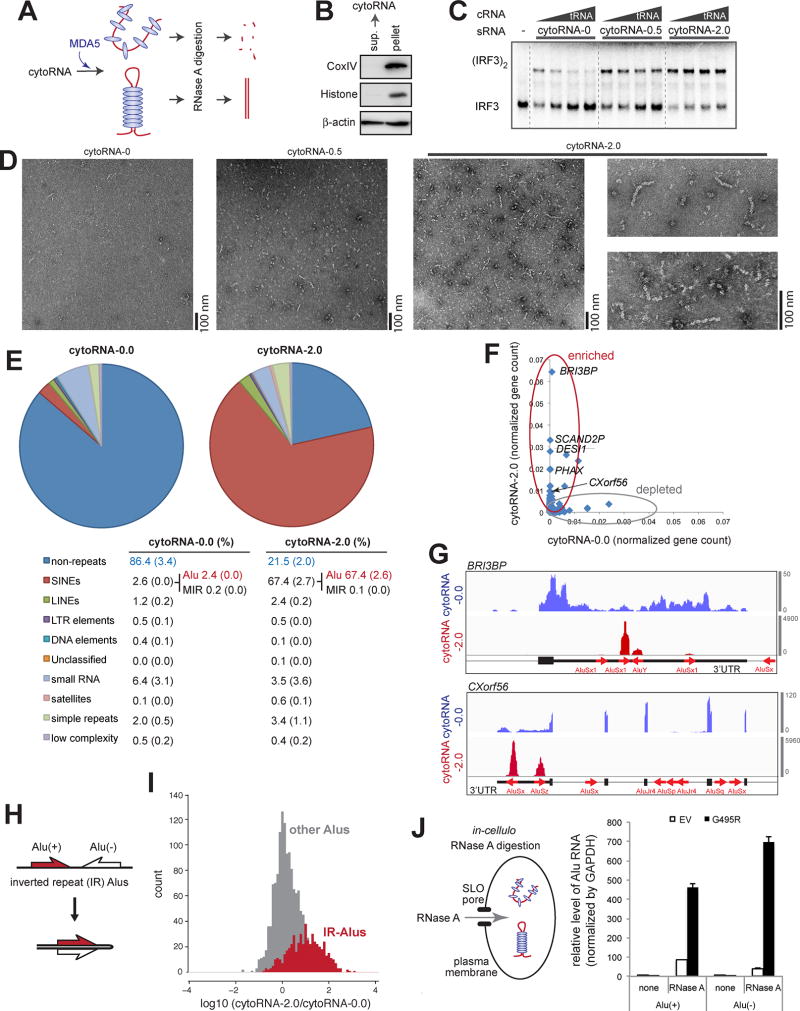
Figure 3. Alu:Alu hybrids formed by IR-Alus are the primary ligands for G495R MDA5.
(A) Schematic of the RNase A protection assay. Cytosolic RNA (5 ng/µl) from 293T cells was pre-incubated with purified MDA5 G495R (150 nM), treated with RNase A, and recovered for subsequent biochemical and functional analyses (See Methods).
(B) Western blot analysis of the 293T cytosolic fraction, from which cytosolic RNA was purified.
(C and D) IRF3 dimerization (C), filament formation (D) assays with RNAs recovered from the G495R-protected digestion. CytoRNA-0.0, −0.5 and −2.0 indicate RNAs recovered after digestion with 0.0, 0.5, and 2.0 ng/µl of RNase A, respectively. Same mass concentrations (0.5 ng/µl for IRF3 dimerization and 2.0 ng/µl for EM) of RNAs were used. IRF3 dimerization was measured in the presence of an increasing concentration of competitor tRNA (cRNA, 0–8 ng/µl).
(E) RNA-seq followed by RepeatMasker analysis of cytoRNA-0.0 and cytoRNA-2.0. The table below shows averages (standard deviations in parenthesis) of two independent biological repeats.
(F) Normalized gene counts of cytoRNA-2.0 plotted against cytoRNA-0.0.
(G) Distribution of sequencing reads of cytoRNA-0.0 and cytoRNA-2.0. Two representative genes (BRI3BP and CXorf56) from the top enriched genes are shown. Thin, medium thick and thick lines represent intron, UTR and CDS, respectively, according to the GENCODE v24 annotation. Red arrows represent Alu elements according to the RepeatMasker annotation. Y-axis represents read count.
(H) Schematic of Alus in the inverted repeat (IR) configuration.
(I) Histograms of the enrichment factors of IR-Alus (gap between Alus < 1 kb) (grey) and other Alus that do not meet the IR-Alu criteria (red).
(J) Left: schematic of the in-cellulo RNase A protection assay. G495R Δ2CARD (or empty vector, EV) was ectopically expressed in 293T cells and RNase A was transiently introduced through the pore forming protein, SLO (See Methods). Right: the level of Alu RNA relative to GAPDH after in-cellulo RNase A digestion. Data represent mean ± SD (n=3).
See also Figure S3.

