
Figure 1.
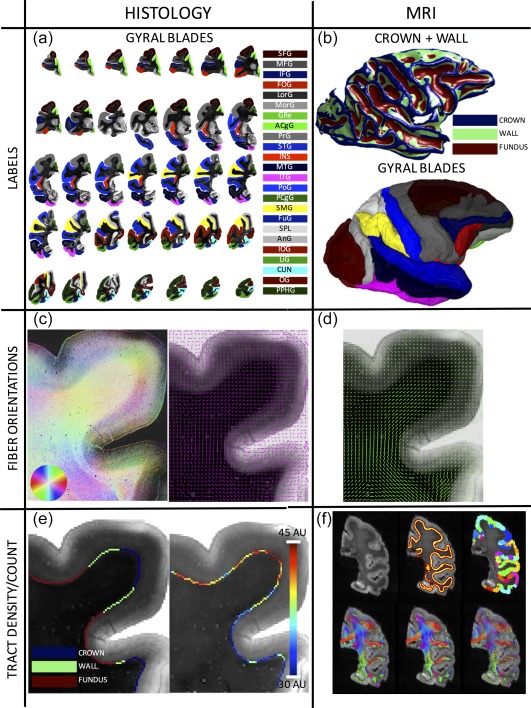
Data processing pipeline. From the histological (left column) and MRI (right column) datasets, six pieces of information are extracted. Twenty‐four gyral blades are manually defined on histological slices (a), while labels for the crown, walls, and fundi are defined based on convexity measures from 3D MRI data (b). The 3D WMGM surface colored with the crown/wall/fundus labels are shown on top, while the gyral labels transferred to MRI space are shown below (note color scheme is same from part 1). Structure tensor analysis (c, left) is used to extract the myelinated, or ground truth, axon orientations (c, right), for comparisons with dMRI estimated fiber orientations (d) after transformation to histological space. A count of axons entering the cortex is made along the entire gyral blade, in gyral crowns and sulcal walls (left) for the myelinated tract density measurement (right) (e), for comparisons with the dMRI tractography connectivity and fiber density measures (f). Shown on top are a select slice from the b0 image, the WMGM boundary, and gyral labels segmented into crowns, walls, and fundi. On bottom are shown results from various tractography algorithms (from left to right: DTI, M1; DTI, M2; CSD, M1) [Color figure can be viewed at http://wileyonlinelibrary.com]