
Figure 6.
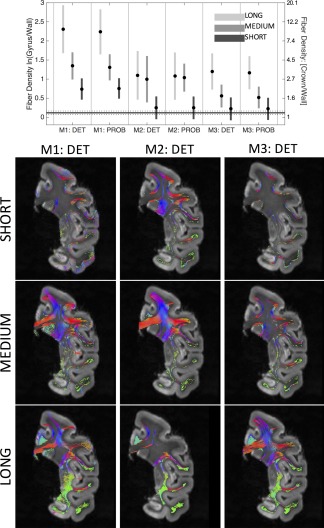
The effects of fiber length on gyral bias. The (unscaled) fiber‐density profile across all gyral blades is shown for long, medium, and short fibers (top). A subset of long, medium, and short fibers is shown for each of the three tracking strategies for a select coronal slice (bottom) [Color figure can be viewed at http://wileyonlinelibrary.com]