
Figure 11.
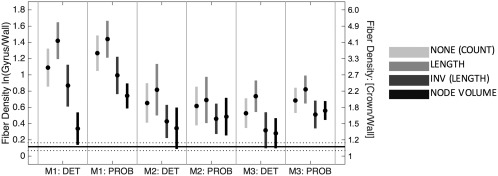
CSD streamline bias is reduced compared to DTI (compare to Figure 4), but is still greater than histological ground truth. Mean (circle) and 95% confidence intervals (vertical line) are shown over all gyri for each CSD tracking algorithm. Four quantification strategies include (1) no scaling, (2) scaling by length, (3) inverse streamline length, and (4) inverse node volume. Histological mean and 95% confidence intervals across all gyri are shown as horizontal solid and dotted lines