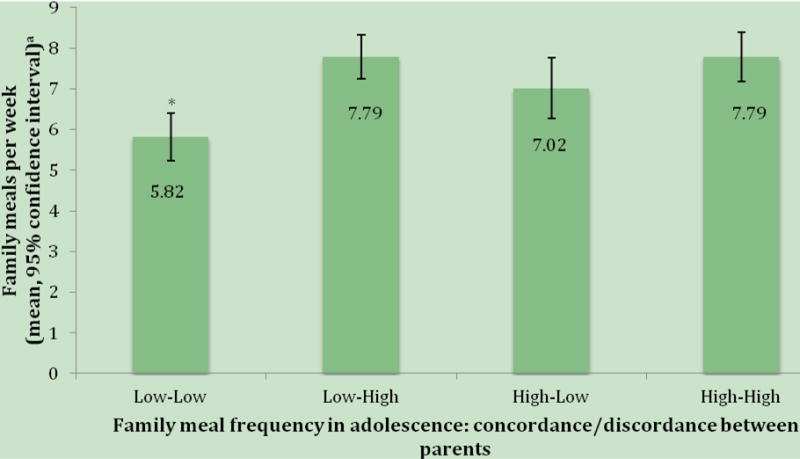
Figure 1. Mean number of family meals per week among families (N=380) by concordance and discordance in parents’ family meal frequency as an adolescent.

Data come from surveys collected in 1999 (EAT-I) and 2016 (EAT-IV) from participants of Project EAT, a longitudinal cohort of adolescents from Minneapolis-St. Paul, MN, who identified as parents and from the significant other of cohort participants at EAT-IV.
aMeans adjusted for participants’ age, gender, and educational attainment, and their socioeconomic status as an adolescent (primarily based on parent education)
*Significantly different from other groups (Bonferroni adjusted p<.002)
Low-low (n=104) represents the longitudinal cohort participant and their significant other reporting < 5 family meals per week as an adolescent
High-high (n=91) represents the longitudinal cohort participant and their significant other reporting ≥5 family meals per week as an adolescent
High-low (n=62; EAT-I participant only reported ≥5 family meals per week as an adolescent) and low-high (n=120; significant other only reported ≥5 family meals per week as an adolescent) represent couples who were in different family meal frequency categories as adolescents.
Family meal frequency was collected as an adolescent (EAT-I) among the longitudinal cohort participants and was collected as a retrospectively at EAT-IV among significant others of the longitudinal cohort participants.
