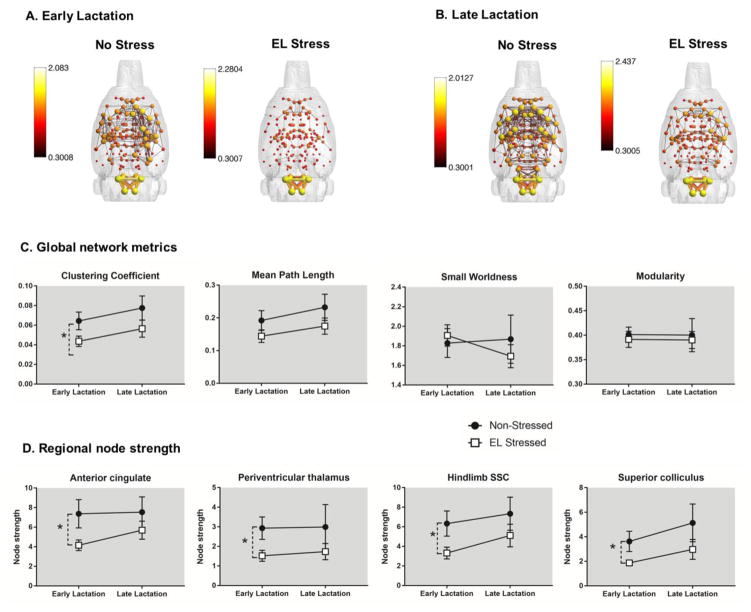
Fig. 3.
Composite 3D functional connectivity maps comparing control and early life social stress (EL Stress) exposed maternal rats in early (A) and late (B) lactation. Scale bar indicates lower and upper bounds statistical threshold for 3D network maps. (C) Graph network measures in non-stressed and stressed exposed maternal rats in early and late lactation. (D) Node strength in various regions of interest. Data presented as mean ± standard error. *Significantly different (two way ANOVA, p <0.05).

