
Figure 3.
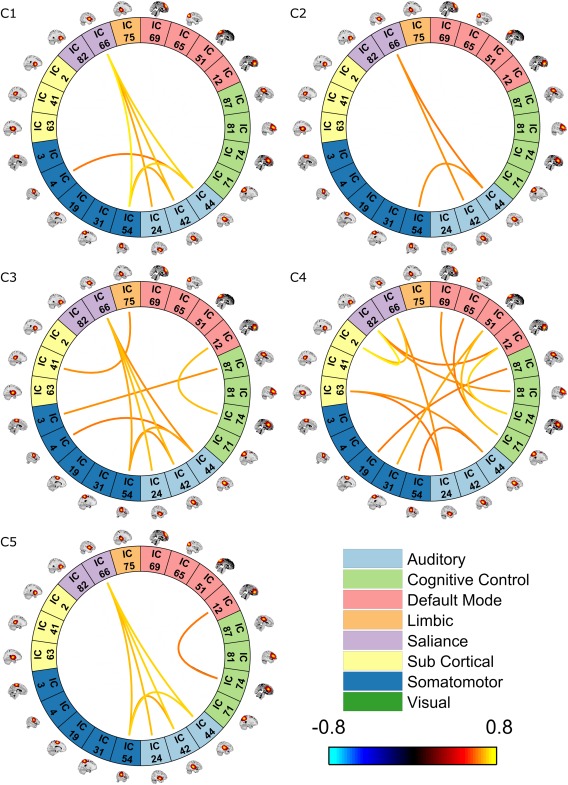
Interdomain cluster centroids. Clustering dynamic connectivity for all participants resulted in 5 clusters and their representive matrix. These matrices were then thresholded (0.6). Only interdomain correlations are shown [Color figure can be viewed at http://wileyonlinelibrary.com]