
Figure 4.
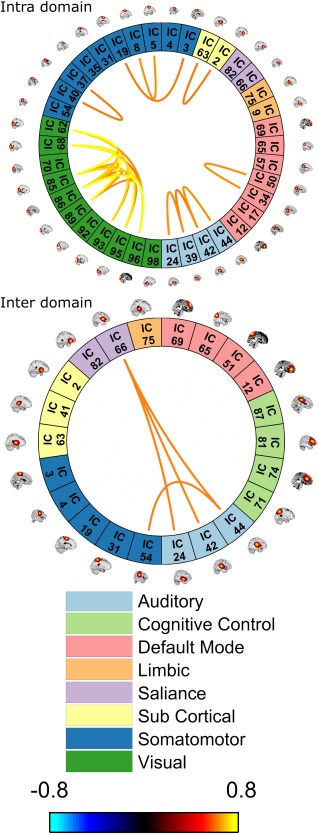
Static functional connectivity. For comparison with dynamic connectivity, the static connectivity matrix was thresholded at 0.6 (the same as that used for dynamic connectivity clusters). The intradomain connectivities are shown at the top, with the interdomain connectivities below [Color figure can be viewed at http://wileyonlinelibrary.com]