
Figure 6.
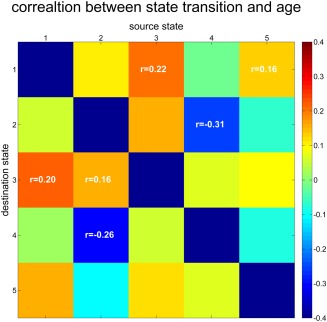
Correlation between age and state transition. The number of state transitions was calculated for each state pair and then correlated with age controlling for gender, mean framewise displacement, and scanning site. Results were corrected for multiple comparison with FDR (p = .01) and only significant correlations are displayed in this figure [Color figure can be viewed at http://wileyonlinelibrary.com]