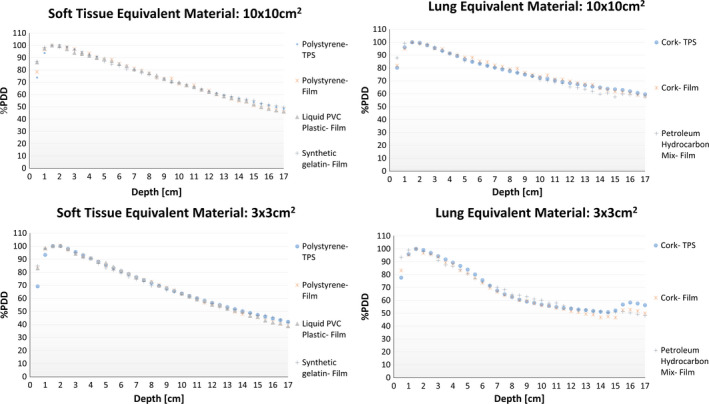
Figure 4.

The four graphs are a summary of the PDD curve comparisons between IROC‐Houston's current soft tissue and lung equivalent materials and testing materials for a large (10 × 10 cm2) and small (3 × 3 cm2) field size. The interfaces between the testing materials and polystyrene of the PDD phantom occur between 5 cm and 15 cm. All graphs show the current tissue substitute's film (red) and treatment planning (blue) PDD curves. The testing materials were then compared to current tissue's film and TPS PDD curves. The greatest curve deviation occurs for the lung equivalent material for the small field size. [Color figure can be viewed at wileyonlinelibrary.com]
