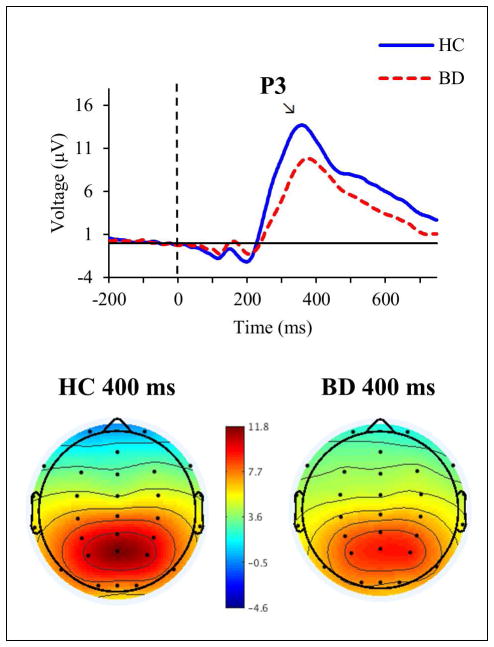
Fig. 2.
Top: grand averaged event-related potentials at Pz in response to target tones in healthy controls (HC; blue solid line) and individuals with bipolar disorder (BD; red dashed line). Bottom: topographic maps of voltage across all scalp channels in HC (left) and BD (right) at 400 milliseconds (ms) post-stimulus.

