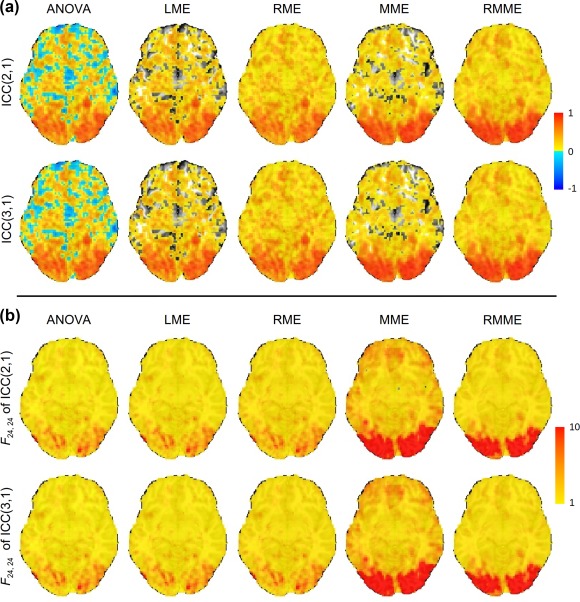
Figure 1.

Panel A. ICC maps on an axial slice (Z = −6 mm, TT standard space; radiological convention: left is right) with a whole‐brain dataset through four models. The conventional ANOVA (first column) and LME (second column) rendered substantial number of voxels with negative (blue) and zero (not colored) ICC values, respectively. Panel B. The F‐statistic maps corresponding to each of the ICC maps in Panel A are shown with colors in the range of [1, 10], with the lower bound of 1 defined by the formulation of F‐statistic in (5). In each case, the degrees of freedom were (24, 24) [Color figure can be viewed at http://wileyonlinelibrary.com]
