
Figure 3.
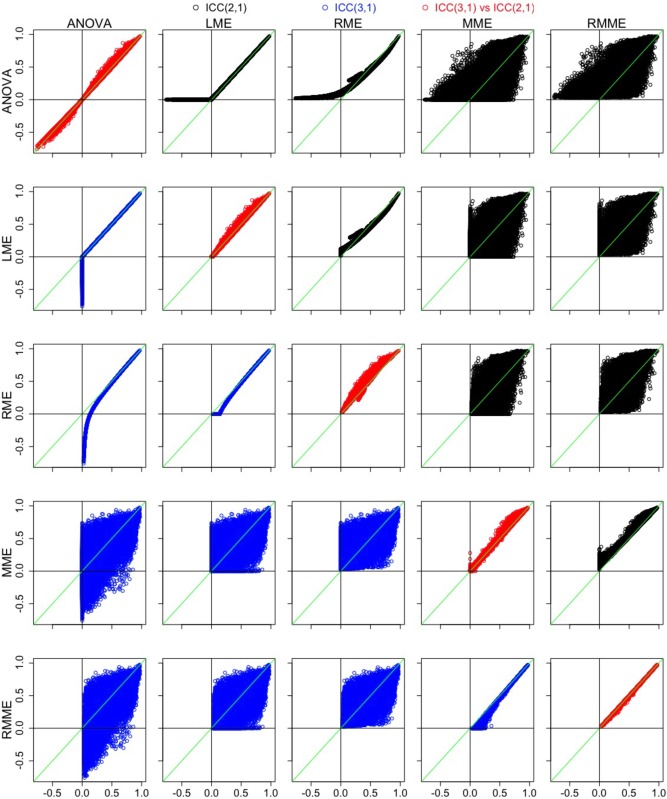
Comparisons across the five models and between ICC(2,1) and ICC(3,1) through scatterplots of ICC with the voxels in the brain. The x and y axes are a pair of ICC values between two of the five models with their labels shown at the left (x axis) and top (y axis), respectively. The 10 combinatorial comparisons for ICC(2,1) are illustrated in the upper triangular cells in black; the 10 combinatorial comparisons for ICC(3,1) are listed in the lower triangular cells in blue; and the diagonals compare the two ICC types in red for each of the five models with ICC(2,1) and ICC(3,1) as x and y axes, respectively. In each plot, the green diagonal line marks the situation when ICC(2,1) = ICC(3,1) [Color figure can be viewed at http://wileyonlinelibrary.com]