Figure 3.

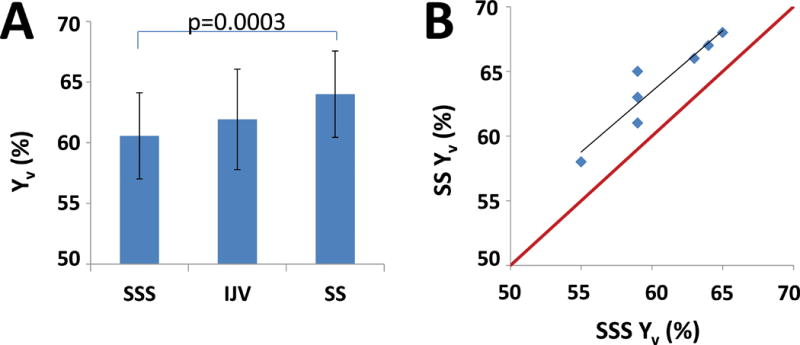
Results of the venous oxygenation measurements. (A) Yv at the major veins. (B) Scatterplot between the SSS-Yv and the SS-Yv. Red line indicates unity line. Black line indicates the linear regression.

Results of the venous oxygenation measurements. (A) Yv at the major veins. (B) Scatterplot between the SSS-Yv and the SS-Yv. Red line indicates unity line. Black line indicates the linear regression.