
Figure 1.
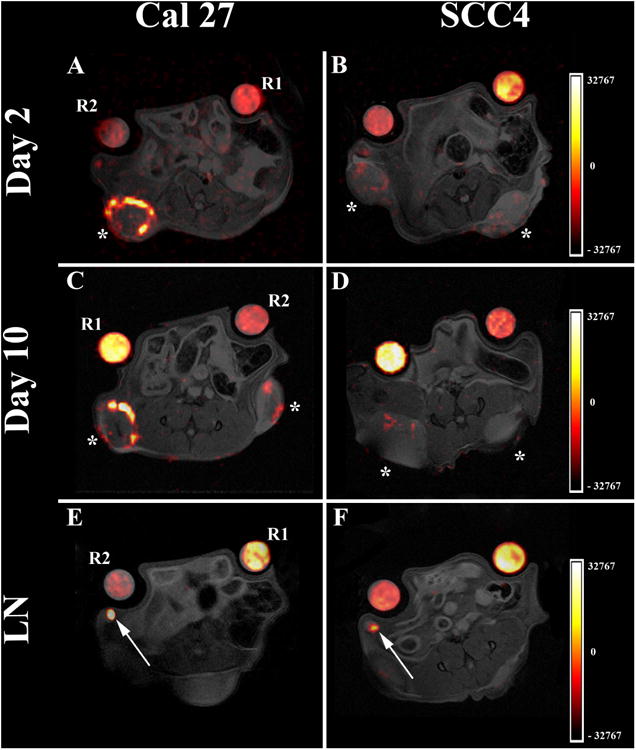
In vivo MRI displaying PFC distribution in the tumor periphery and draining lymph nodes. A. and C. Representative 1H/19F pseudo-color overlays of a mouse bearing Cal27 tumors showing significant macrophage infiltrates in the periphery of the tumors at day 2 and 10 respectively. B. and D. Representative 1H/19F overlays of a mouse bearing SCC4 tumors showing decreased macrophage burden at day 2 and 10 post PFC injection. E. and F. Corresponding 1H/19F pseudo-color overlays demonstrating fluorine hotspots (arrows) within local lymph nodes (LN) of the same animals in both Cal27 (E.) and SCC4 groups (F.). Tumors and lymph nodes were not visible in the same axial plane and therefore alternate slices were selected to show lymph node hotspots. Asterisks indicate the implanted tumors; R1 and R2 indicate tubes for reference quantification and the color scale is in arbitrary units.