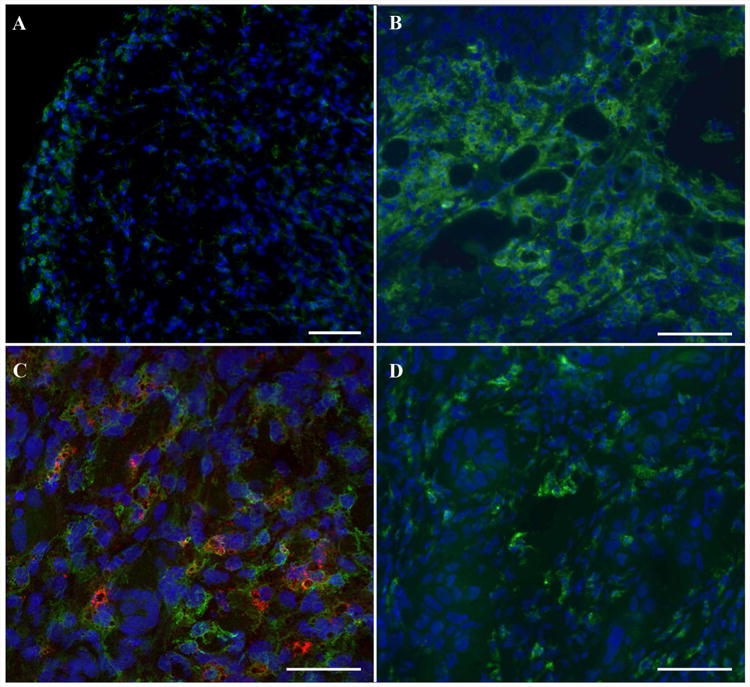
Figure 4.

Immunofluorescence images of excised tumors. A. Low magnification immunofluorescence staining displays green fluorescent signal from TAMs (anti-mannose receptor, green), which confirming accumulation in the periphery of the tumors, and is consistent with the 19F MRI (Fig. 1). Scale bar is 100 μm. B. Qualitatively, numerous macrophages are observed within Cal27 tissue samples. C. Shows composite image of fluorescent dual-mode PFC (VS-1000H-DM Red) and macrophage (anti-mannose receptor, green) immunostaining and demonstrates intracellular uptake of PFC agent by macrophages in a Cal27 tissue sample. D. SCC4 tissue stains show scattered macrophages. Nuclei are stained with blue Hoechst 33342 stain. Scale bars (B-D) = 25 μm.
