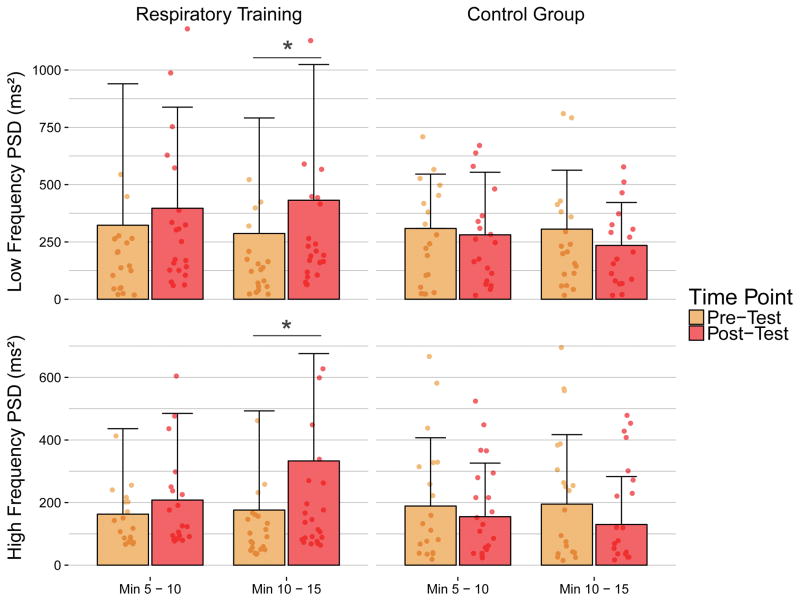
Figure 4.
Heart rate (HR) variability during orthostatic stress test. Sitting power spectral density (ms2) from the Respiratory Training (RT) (n=24) and Control (n=20) groups during minutes 5–10 and 10–15 in the low and high frequency (LF and HF, respectively) bands. There was a significant increase in LF and HF power in the last 5 minutes of the sitting position in the RT group.

