Figure 1.

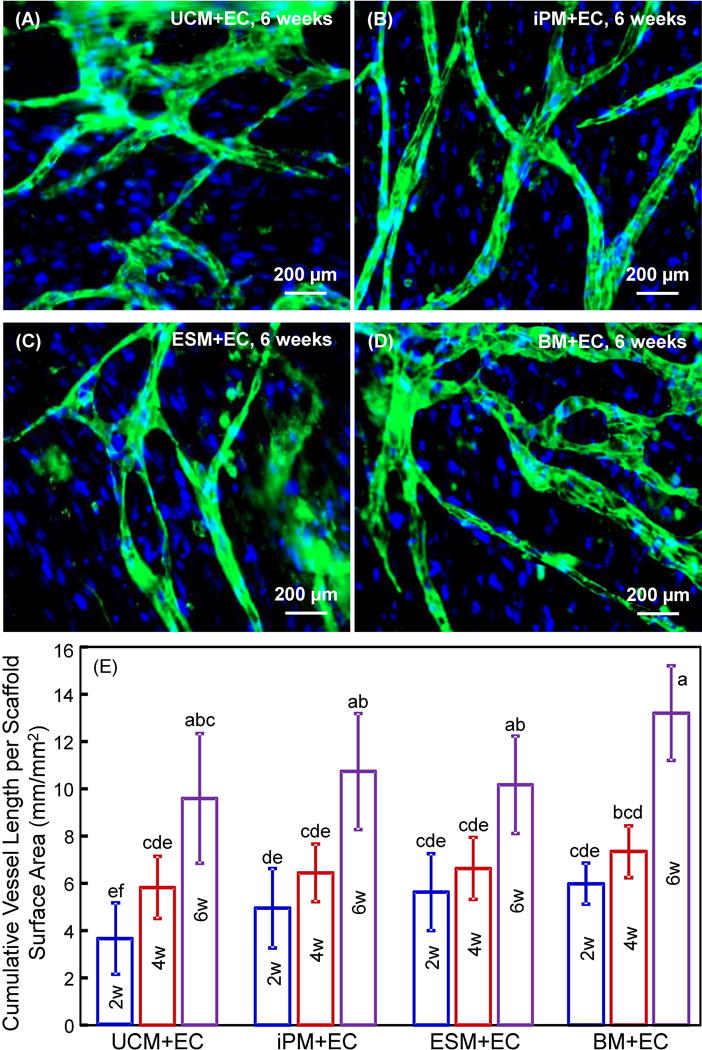
hUVECs with hUCMSCs, hiPSC-MSCs, hESC-MSCs and hBMSCs had capillary-like structures. (A–D) Typical fluorescent images of coculture at 6 weeks with microcapillary structures on macroporous CPC-RGD. (E) Cumulative microcapillary length per scaffold surface area (mean ± sd; n = 5). hUCMSCs = UCM. hUVECs = EC. hiPSC-MSCs = iPM. hESC-MSCs = ESM. hBMSCs = BM. Week = w. Values that share the same letter (for example, the four groups at 6 weeks share the same letter a) are not significantly different from each other (p > 0.1). Values indicated by different letters (without any letter that is the same) are significantly different from each other (p < 0.05).
