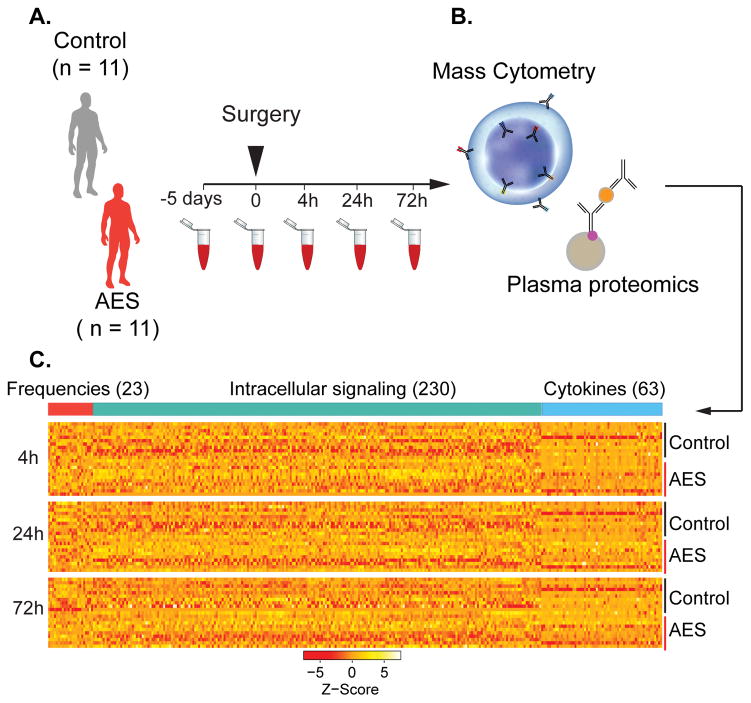
FIGURE 1. Experimental flowchart and analytical approach.
(A) Whole blood was obtained 5d and 1h before surgery, and 4h, 24h, and 72h after surgery. (B) Aliquots were stained with cell surface and intra-cellular antibodies and analyzed with mass cytometry. Plasma proteins were measured using a Luminex 63-plex assay. (C) Assays produced three data layers providing information about cell frequencies (red bar), cell signaling (green bar), and plasma protein concentrations (blue bar).

