
Fig. 3.
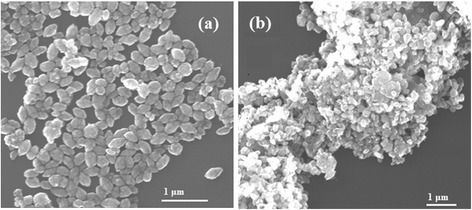
SEM images of ZnO samples under various conditions of (a) 0.015 M, 5 mL, and 170 °C and (b) 0.05 M, 5 mL, and 170 °C
Official websites use .gov
A
.gov website belongs to an official
government organization in the United States.
Secure .gov websites use HTTPS
A lock (
) or https:// means you've safely
connected to the .gov website. Share sensitive
information only on official, secure websites.
SEM images of ZnO samples under various conditions of (a) 0.015 M, 5 mL, and 170 °C and (b) 0.05 M, 5 mL, and 170 °C