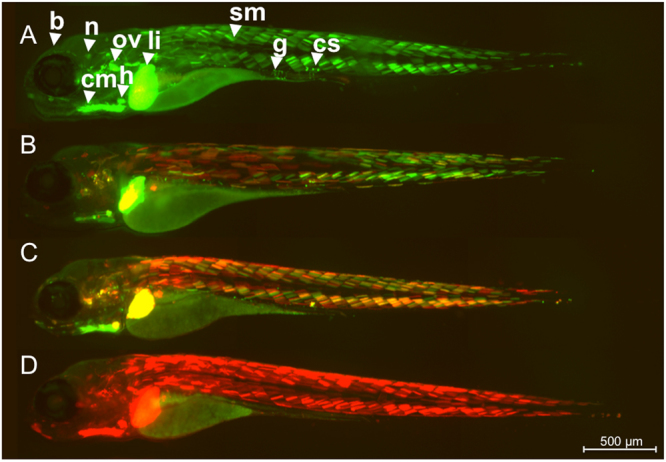
Figure 2.

Kaede conversion analysis. ERE-Kaede-Casper larvae were exposed to 100 ng EE2/L over the period 0–5 dpf and imaged at 5 dpf either without UV exposure (A), or after exposure to UV at 3 dpf (B), 4 dpf (C) and 5 dpf (D) to convert Kaede fluorescence from green to red. Specific tissue response in the liver (li), heart (h), somite muscle (sm), otic vesicle (ov), cardiac muscle (cm), corpuscle of Stannius (cs), brain (b), neuromast (n), and gut (g).
