
Fig. 3.
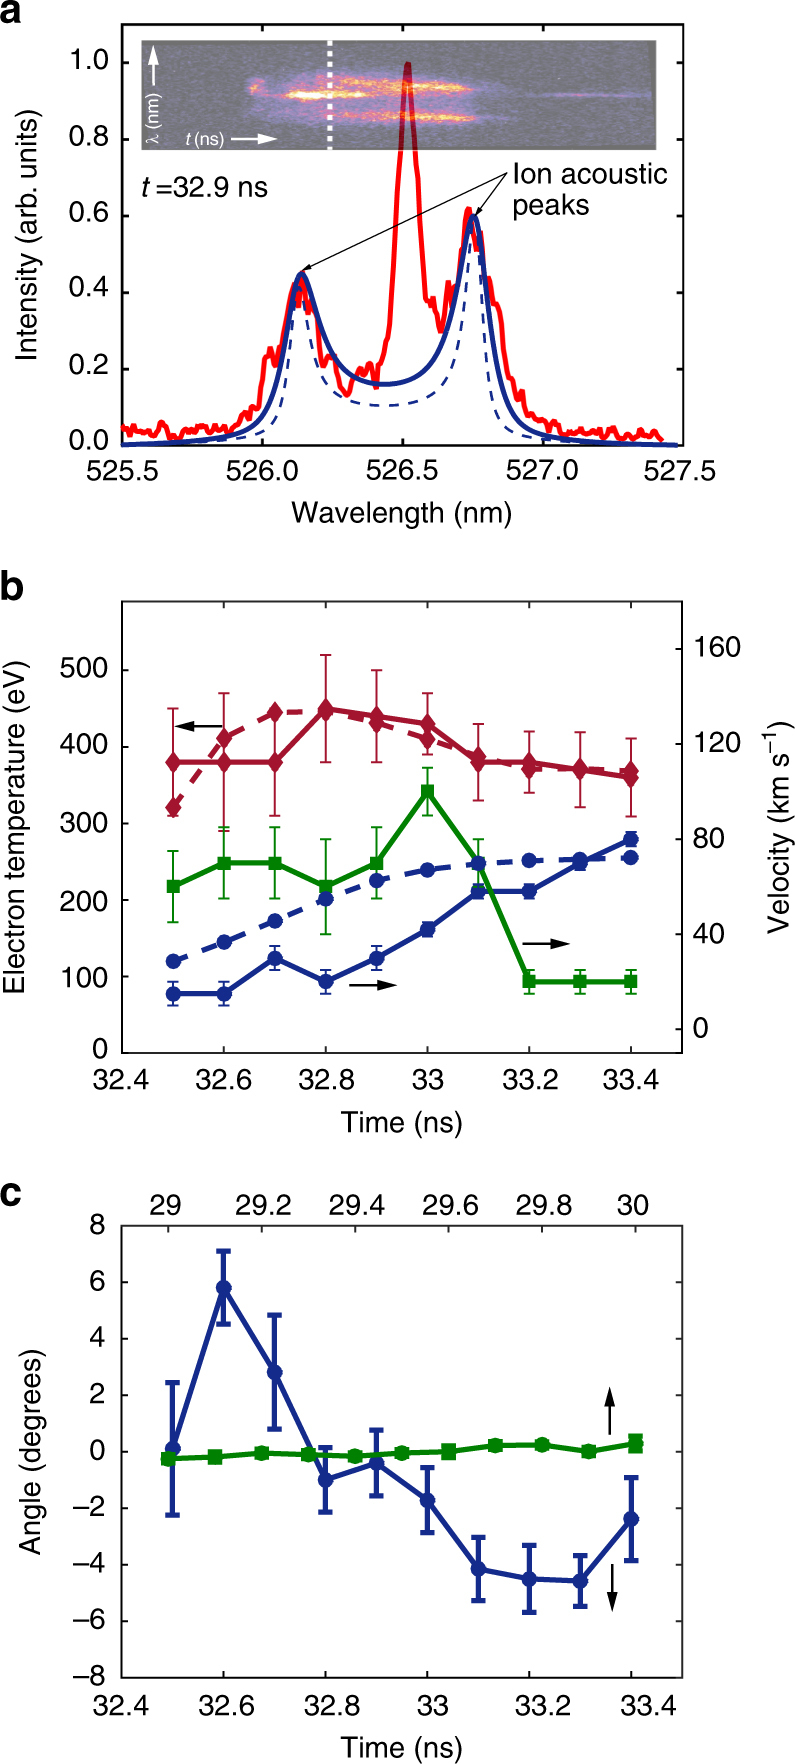
Thomson scattering measurements. Electron temperatures and flow velocities are obtained by fitting the experimental data with the frequency-dependent Thomson scattering cross-section37. In the fitting procedure we assumed an electron density of ≲1020 cm−3 (as predicted by FLASH simulations). At these electron densities, the frequency distribution of the scattered light does not depend on the electron density, which only provides an overall normalization factor. a Thomson scattering data (red solid line) at t = 32.9 ns obtained from a target driven with the 5 ns pulse profile. The blue dashed line corresponds to plasma in thermodynamic equilibrium (assuming equal electron and ion temperatures). The central peak is due to stray light at the probe laser wavelength (and it is used to determine the instrumental resolution of the spectrometer). The blue solid line corresponds to the case in which additional broadening due to turbulence is included in the fitting procedure. The inset in the top panel shows the time-streaked image of the Thomson scattered light. The resolution of the streak camera is ~50 ps and the Thomson scattering signal is fitted every 100 ps. b Flow velocity towards grid B (full blue circles), turbulent velocity (full green squares), and electron temperature (full red diamonds) as measured by Thomson scattering for the case of a target driven with the 5 ns laser profile. FLASH simulation results for the electron temperature and flow velocity in the probe volume are also reported in dashed lines. The error bars are estimated from the χ2 fit of the data. c Estimated Faraday rotation data from the Thomson scattering data. This was done by separating the scattered light into two orthogonal polarizations (see Supplementary Methods). The blue line corresponds to the same conditions as b, above. The green line was obtained from an experiment involving a single-flow, single-grid experiment only, when the magnetic field is expected to be significantly smaller (see Supplementary Figure 8 for the proton radiography results arising for a single-flow, single-grid experiment). The errors are determined by the standard deviation of the data within the shot